Category Archives: top

the top post’s show with small thumbnail

A mature Fused Grid plan in Manhattan, NY

By Fanis Grammenos

—————————-

Cities print their history in stone. To read it takes deciphering just as if it were written on a very large Rosetta tablet. The first impression that jumps out when looking around is their constant growth and evolution: they grow ever-bigger, ever busier, richer and diverse; as if an unfathomable people-magnet was at work.  And they change: buildings morph into shapes unseen before; entire city blocks are reshaped; streets are straightened, widened or, conversely, twisted, blocked and narrowed. In some cases, where people used to walk freely becomes prohibited terrain and, in others, where cars were the main occupants disappear out of sight. What explains all this constant commotion, perpetual rearrangements?


 The Stuyvesant layout transforms the old grid into a Fused Grid

The Stuyvesant layout transforms the old grid into a Fused Grid

For example, the stone-text does not explain why certain places have only straight streets and square blocks, as Manhattan does, and others have hardly any, like the center of Boston or Istanbul. Nor does it reveal why perfectly straight streets in the older parts of certain cities morph into curvaceous shapes in their newer extensions at the edge.

A simple answer says that they evolve to adapt to new pressures and a new culture. But this abstract talk explains little, e.g.: What are the pressures and which are the matching adaptations? Such are the questions that naturally spring up on encountering a large, enduring development in New York – Stuyvesant Town.

When walking downtown along 14th street you realize that a dramatic transformation happened in the area north of 14th street and east of 1st Avenue: The familiar repetition of streets and blocks suddenly stops; the 200-year old grid of numbered streets and avenues that dominates Manhattan dissolves. Instead, the streets that enter at its boundary turn around and exit on the same road. What prompted its planners to give up the grid? Why the transformation?

 
The company’s management has broader future plans of expanding to a larger spectrum and generic viagra germany it has already started expanding its infrastructure in order to accommodate its future requirements How to use a Dell Laptop ePSA Error Code to Help Resolve Your Issue after Running the ePSA Diagnostics Understand the ePSA codes The ePSA codes are a set of exercises specifically designed for penis. Several viagra online from canada appealing supplements have recently emerged and might provide useful information related to the cause of Erectile Dysfunction. Seasonal allergic rhinitis Perennial allergic rhinitis Allergies occur in certain seasons The form of pollen allergens, wood, levitra discounts grass, etc. Take this drug around 30 minutes before the appointment sildenafil tablets here are the findings time.

A tranquil street that connects parts of the neighborhood

A walk through the neighbourhood and a scoop of history provide some clues. The fist overpowering impression is that you are now in the country, that you left the city with its noise, smell, dust, cars, and frenetic pace behind; coolness, freshness and quiet prevail. You are in a protected “garden” where nature dominates your senses and restores your mood.  These effects can be traced to the eve of the 20th century when planners dreamed of marrying the country and the city in a “perfect union” and launched a global “garden city” movement. Stuyvesant Town could well be a realization of that dream with an important twist: The pioneers went to the country to build the good city, Stuyvesant brings the country into the city; city density  combined with the restfulness and tranquility of a garden.

A central neighborhood square where all major pedestrian paths converge
A central neighborhood square with a fountain where all major pedestrian paths converge

Another synapse fires when you realize the scarcity of ordinary streets and abundance of paths. Instead of cars racing by, only people stroll by: young and old, couples and kids; each moving freely at their own pace. In the few minutes that it takes to cross the neighbourhood, you walk mostly under a tree canopy or near a fountain or beside a grass-bed and flowering plants. Though built decades before the term “sustainability” was coined, this neighbourhood has all the qualifying ingredients: more walking than driving; proximity to public transit; less asphalt, high proportion of absorbing surface; large tree canopy and abundant shrubbery that reduce the heat island effect and increase rain absorption; high residential density; and primary convenience amenities nearby. It also encourages a healthy, active lifestyle with its tennis and basketball courts, swimming pool and daily recreational running, walking and sunbathing. Its buildings do not shade one another, offer plentiful sky-view and good exposure to sunlight. Parking is out of sight below grade, thereby restoring the ground to nature and people. This “must-do” list for any “green” place checks out fully in this 60-plus year old neighbourhood. It could well be that its planners were in tune with the emerging green priorities ahead of their time. Now it can lay claim to an honorary title – Sustainable. And one more too – Sociable; nothing encourages casual social contacts more than the unhurried, peaceful walking environment of its common grounds.

Its plan layout that renders it sustainable, sociable and delightful, however, remained nameless, undecipherable; a pictogram or ideogram that had no match in the planning vocabulary, at least not until recently when two new terms were coined – Fused Grid and Filtered Permeability: fusing but not always mixing active travel with motorized; where one stops the other takes over; methodically in pattern-like configurations, similar to Stuyvesant’s plan. And “filtering out” motorized travel and “filter through” active modes such as walking, biking and rollerblading by design as in Stuyvesant Town; a coveted, profitable development and a great model to follow: A practical, workable version of the “garden city” idea.


Building Hybrids

By Fanis Grammenos

Our house types lexicon includes standard, familiar species such as single detached, semidetached, townhouses, walk-ups and apartments. Each of these carries a set of images, an identity, and with it, deeply rooted feelings.  “House,” for example, spontaneously evokes privacy, independence, tranquility, a garden, and, frequently, a happy family and wealth.

These stereotypical associations often misjudge specific samples of homes and places; a “house” can range from a simple abode to an elaborate estate.  The same is true for other types. Some past “townhouses”, for example, were homes to prosperous citizens and were so exquisite that are now coveted masterpieces of domestic design. Prominent public figures raised families in spacious and well-appointed “apartments” at the city center close to their offices. Today, select downtown condominiums provide space, amenities and finishes that only few houses can boast about.

A new type of Townhouse provides privacy and comfort

Yet there is some basis to the typical reaction and rushed judgement by established residents when they object to certain “types” in their community. Commonly, each type of accommodation has been segmented by district, price range, amenities and, inevitably, by income or lifestyle groups. Walk-ups, for example, usually have no common open space or, when they do, it is a leftover, uninviting, unattended area that detracts, rather than bolsters, overall desirability. Similarly, townhouses are often too narrow for a driveway and a proper entrance, leaving no space to grow a welcoming tree. These drawbacks sustain a stained image but are not inevitable; they can be overcome with ingenuity and innovation.

Innovation

Breaking the mould and demolishing stereotypes burns creative builders’ candles. Innovators search for adaptations, combinations and fusions. The typical narrow-front townhouse mould, for example, has been broken in at least two ways: by moving the car to the back in a lane-way or by making the lot wider and shallower; both increase house appeal and make economic sense. The next adaptation of the townhouse type includes a fusion and a transformation.  It blends one-storey units with two or three-story ones in groups of six to eight and sheds the boring, unattractive,  endless repetition of identical units in a military row. Each group is crafted to give the appearance of a unique, large Manor House. This fusion attracts a wider range of individuals from different strata, income and life stages, from the young family to the retired couple. One more successfully tested hybrid on the repertoire.

Forzest is a FDA approved medicine set viagra cialis achat with every standard of safety and quality. In Type 1 diabetes, beta cells are online viagra overnight http://www.tonysplate.com/blog/index.php?itemid=13 not able to function. Presently the only form of treatment is by free viagra online introducing insulin through injections or an insulin pump. Though most joints allow for bone movement-as in the knees-the sacroiliac joint is essentially immovable. levitra prices canada

The lines of hybrids keep expanding from the well-used residential tower on top of a commercial ground floor to shopping malls with libraries or universities and to multi-story parking structures with at-grade commercial uses. All these blends increase project viability, street vitality and customer appeal.

But a major fusion has been happening recently in housing types both in function and in appearance. An extension of the reconfigured townhouse is its fusion with the conventional, and usually plain, three-and-a-half storey walk-up. Walk-ups occupy the top rung of layout and construction efficiency and, with it, the claim to affordability. With these two advantages entrenched, the new hybrid blends the merits of the townhouse with this form and opens up new opportunities for neighbourhood site layout.

The new building form creates exclusive pedestrian streets and private outdoor patios

The fusion gives every unit a front door, as in a townhouse, and to the units at grade a front patio for favourite outdoor activities and the occasional neighborly talk. The addition of balconies on the upper floors placed judiciously, gives the assembly the look of a grand villa with a portico.  Finally and crucially the new form acquires urban civility by putting the cars under the building. You might call it a triple fusion except that this new building allows for a fourth: fusing roads with exclusive pedestrian streets. Gone is the asphalt with sidewalk cuts for access to each townhouse garage. In its place, there is a pedestrian bricked path, fully landscaped, free of risk, noise and car fumes; a refreshing experience. Gone also are the miniscule, almost unusable townhouse backyards; they are reborn as a sizable neighborhood park landscaped to accommodate play, rest, contemplation and casual socializing: a breath of community.

The new hybrids in building and neighborhood layout are showing the way to safe, enjoyable and satisfactory living; a living that also has a lighter carbon footprint: the most frequent and pleasant way to move around in such neighbourhoods will be on foot. Due to its modest density, conveniences will emerge a short walk away. And with parents and kids re-appearing in the exclusive pedestrian paths, the familiar image of a car-packed street will fade into memory.

Blending traditional building types and fusing pedestrian streets with common roads, opens the hybrid way to efficient and rewarding neighborhoods.


Navigation and Legibility


In an earlier article, Beloved and Abandoned, we presented the grid plan, using Portland’s layout, as a historic relic perhaps deserving of attention but clearly unfit for replication in contemporary settings. That, evidently, is not occurring in any case. Several commentators quickly pointed to the supreme legibility of the simple grid as a counterpoint; clearly an indispensible attribute, they said. But is it?

The value of legibility lies in its presumed link to navigation. It is assumed that good legibility makes navigation easier. But does it?  Is a simple, orthogonal geometry aligned with the cardinal directions a necessary condition for easy city navigation? Apparently not, as we shall see.

Though related, the two concepts, navigation and legibility, are quite distinct. One is about an act and the other about a mental construct. “Navigation” and “way-finding” appear interchangeably in architectural and planning literature and they both mean reaching a destination with ease. “Legibility” which originates from text reading, is harder to grasp, but it does relate to a map in the mind, be it a letter, a picture or a configuration of streets. Legibility expresses the ability to project an image and discern its match with what one sees. Navigation as an act could be compared to dancing – a sequence of rhythm-coded steps that is partly or entirely preset and that becomes intuitive.

The first notion to consider in deciphering this puzzle is that navigation, or finding one’s way to a destination, not only predates geometry by millennia, but it is also a basic skill of most sentient, even “non-intelligent,” life. Examples abound from bees to birds to fish and turtles and many more. Closer to home, emotional, and sometimes incredulous, recounting of pets returning from a distant foster home, point to that instinctive ability.

In humans, a few striking examples, first from the non-urban world, show the distinctiveness of the two concepts and the independence of navigation from geometry.

Inuit will trek for many kilometers beyond the base horizon in pursuit of game, often in poor visibility, in what seems an undifferentiated, unremarkable, featureless landscape and, surprisingly to us urbanites, find their way to a destination and back home with astonishing efficiency.  Legibility, understood as a geometric order or map, is entirely irrelevant in this landscape.


 CatamaranPriests_traveling_across_kealakekua_bay_for_first_contact_rituals2

Figure 1. The feat of seafaring for thousands of kilometers in the Pacific Ocean without a single navigation aid still astonishes cultural anthropologists and navy captains (image from Wikipedia)

An even more astonishing example comes from Polynesia. For many centuries before they were “discovered” in 1595, the Marquesas inhabitants had ploughed the vast Pacific Ocean in stone-age-tool-crafted open catamarans to trade with and settle in other distant pacific islands. The crew of ten included a captain and a “wayfinder”, two very distinct roles (the wayfinder does not sleep!). Not a single navigational aid existed on board. These seafaring traders and settlers were able to regularly reach distant ports well beyond the visible horizon, often thousands of kilometers away, with accuracy and efficiency that surpassed by far the skills of fully equipped European sailors.  A great captain, Magellan, for example, sailing west from Cape Horn, missed the Marquesas and other pacific archipelagos to land, months later, with a malnourished and decimated crew, on Philippines.  The Marquesas wayfinder “knew” his directions with infallible precision. Nothing could be less “legible” and more disorienting than a vast, featureless ocean during weeks of sailing.  Evidently in this case, legibility, as a geometric construct, has little to do with navigation.

Sildenafil Citrate was browse around for more info now viagra order uk basically made to treat heart conditions and pulmonary hypertension and can also be obtained online. Almost 1 out of 5 deaths from heart disease are linked with smoking. viagra sale How Propecia works:Propecia works by preventing the order free viagra male testosterone hormone to convert into dihydro- testosterone. The reason why these medicines are called as brand viagra uk is that it does not take any prescription.

 Figure 2: A typical medieval city street network within a perimeter wall, now a peripheral arterial. Visitors get easily lost in the maze, but not its residents.
Figure 2: A typical medieval city street network within a perimeter wall, now a peripheral arterial. Visitors get easily lost in the maze, but not its residents.

 Figure 2: A typical medieval city street network within a perimeter wall, now a peripheral arterial. Visitors get easily lost in the maze, but not its residents.

From the urban world, examples also show that navigation does not depend on legibility.  Most visitors describe Arab cities such as Fez, and Marrakech or Medieval cites such as Vienna and Martina Franca (Fig.2) or Asian cities such as old Tokyo and Mumbai, as mazes, impossible to navigate even with a map in hand. In each case, the street pattern lacks clear geometry, has no uniformity or repetition, is rarely rectilinear and seldom abides with cardinal directions. Yet for many centuries, the residents of these cities thought nothing of navigating through their streets. Even more surprising, these same labyrinthine streets had no names and house numbers, yet posed no difficulty to reaching destinations.  Intensifying the surprise, are the cases of planned Roman cities with a highly legible orthogonal grid that were transformed into maze-like patterns by their subsequent occupants as if legibility was undesirable.


Figure 3. Old Vienna’s street network is typical of many medieval cities: irregular, idiosyncratic, varied bock sizes and shapes with multiple orientations,  maze-like. (green indicates pedestrian-only  streets) Giving verbal instructions to a destination could be an insurmountable challenge; following them, an impossibility.

If navigation was not an issue in these early pre-urban, non-urban and urban conditions, then the introduction of a simple geometric arrangement of straight streets and repetitive blocks would seem unnecessary for that purpose. In fact, Aristotle, long after Hippodamus drew the famous grid plan of Miletus, argued against his configuration and in favour of the old, “organic”, labyrinthine pattern on the grounds of defence, as did Alberti 1,500 years later. Camillo Sitte made the same case on aesthetic grounds, entirely unconcerned about legibility, having lived in Vienna, (figure 3) a medieval city, and grown to admire many other similar cities, with irregular street patterns.

These examples show clearly that humans on foot, on horses, carts and in boats have been able to find their way to a destination in natural, non-urban and in urban environments unaided by geometry and printed maps. The one presumed outstanding feature of the simple grid, legibility, proves to be unnecessary for navigation and simply an after the fact attribution by post-Guttenberg humans looking at maps.

Fanis Grammenos is a principal of Urban Pattern Associates and was a Senior Researcher at Canada Mortgage and Housing Corporation for over 20 years. He focused on housing affordability, building adaptability, municipal regulations, sustainable development and, recently, on street network patterns. Prior to that he was a housing developer. He holds a degree in Architecture from the U of Waterloo.


The Hopscotch Proof


Two widely reported, and most likely related, trends have planners and parents concerned: the increasing number of overweight children and the growing number of hours kids spend looking at a screen, be it a television or laptop.  And between the two of them, they take most of the free time kids have after school.  Add to these trends the tendency for kids to be driven or bussed to school and you get what has been coined as “nature deficit”; kids growing up not connecting with their natural surroundings.  Over the long run, the outcome could be physically unfit and socially maladjusted young adults. The warning statistics are all around us.

Is there a way out of this unhealthy cycle? Can neighbourhoods be laid out so as to avoid these unwelcome results?


Evidence from research pronounces an unequivocal ‘yes’. Many pieces shape the puzzle that forms the complete answer:  One has to do with what draws people out of their houses and prompts them to socialize with neighbours.  Since 1980, several studies have shown that the great inhibitor to socializing on a street is traffic: the heavier the traffic the less the socializing. Invariably, the less the socializing the fewer the friends adults and kids can make and the lower the attraction to get out of the house becomes. The latest, 2008 study, showed that people on a cul-de-sac had four times as many friends and two times the number of acquaintances than residents on through streets with heavy traffic. It seems intuitive and proof confirms it.

A second piece paints a picture of what streets young kids play most on: you may have guessed it already; it is the cul-de-sac, research shows. Kids on a cul-de-sac spent 50% more time playing than kids on other streets.  Importantly, kids’ playing on the street is not the end of the story; the benefits continue. Other studies have shown that play and exercise in the early years build an affinity that can last a lifetime.  Other work has also shown that pals tend to do what other pals do more frequently than as single individuals; the spirit of the beehive at work.

A third piece of the picture is about magnets in the surroundings that will pull kids out of their homes and send them walking to school, the corner store and other destinations.  A study found that of all the elements would attract kids of all ages the strongest common force was the presence of open space.

Another piece of the puzzle, though not the last, is how parents feel about letting kids play on the street or walk to school or ride their bicycle. Whether they read the sad statistics or not, they feel uneasy about letting them go.  Justified or not, their fear limits the range of activities that kids can engage and builds unhealthy habits.

The features

With these four pieces of knowledge from the field, we can now sketch out the essential elements of a child-friendly neighbourhood and, beyond that, a child-friendly district. Here is the set:

One, there should be no through streets in an area the size of about ten city blocks. Such a feature will give kids plenty of room to move around in a low-traffic, low-speed environment. Parents will socialize and kids will play. Parents’ insecurity will fade. The easiest way to create that feature is by using connected cul-de-sacs and crescents.

In a relationship it is one of the most effective drugs in treating impotence. canadian viagra online Counseling, groups, changes in your lifestyle can all bring about satisfying and surprising changes for you. levitra low price It instantly provides the order cheap viagra result or a rock hard erection to the men and continues working for at least 4 hours. Worried about where to generic levitra for sale ? Don’t be.

A connected cul-de-sac provides grounds for children's play
A connected cul-de-sac provides grounds for children’s play

Two, every such neighbourhood area should have at least one open space, whatever its size. That would grant a safe haven for play; a magnet.  Its land value will be fully recovered through higher values for the homes around it. Cul-de-sacs and open spaces command higher home values, real estate research shows.

Three, allow for bike and foot paths separated from the road that lead to school or other places with as few road crossings as possible. That will appease parents about letting their kids walk or ride to school and widen their horizons.

Can all this be achieved with a layout? Yes, by selectively fusing well known elements of available community plans.  A number of examples of this fusion exist and plenty of advice is accessible. And these techniques are not just for planning new neighbourhoods; existing places too can be transformed to create child-friendly environments. Initiatives in many cities have changed neighbourhoods with positive results.

Having done all this creative work, how can you tell you succeeded? Is the neighbourhood truly child-friendly? One sure sign is the chalk hopscotch marks left on the pavement! They signal that the kids took possession of a street and were having fun.  And every new family that moves later into the neighbourhood will be heir to its physical and social benefits.

For referenced studies and design solutions try fusedgrid.ca or e-mail the author

 Fanis Grammenos


Innovation in Regulation


Regulation has a Jekyll-and-Hyde, split personality – attentive and autocratic. On one hand it cares and protects, and on the other, it restricts and confines. Abolish it, and watch people begrudge living in a place where everyone makes their own rules. Conversely, few of us wish to live by somebody else’s. Where do you draw the line? There lies the dilemma that many municipalities face when they enact regulations; between ensuring public protection and not limiting the public’s choices; a tricky juggling act.

This dilemma in planning regulations stems from the clash between tradition and innovation, between experience and exploration, and between practices that have worked and techniques that could work. Tradition asserts that something has worked but exploration counters that a new way could deliver better results. Can a balance be achieved between the assurance of past practices and the promise of new?

It can, and here is how Red Deer in Alberta achieved this balance.

A segment of a subdvision plan shows the pedestrian connectors

The issue was, and it will puzzle other municipal heads for a while yet, how to give people on foot an advantage in getting to nearby destinations without restricting their choice of a place to live. Resident location preferences have been documented in market surveys which show consistently a strong desire for living on cul-de-sac and loop types of streets. These types are a fairly recent addition to the street vocabulary, but have quickly gained enormous popularity. Distressingly, they come with a disadvantage – they limit the options for walking to nearby places.  Before the car, that limit would have been an unthinkable restriction on movement; no one would want to walk longer than absolutely necessary for a physically exerting errand. With the car around, this disadvantage seems unimportant. But, it still means limiting personal choice. The obvious solution: Return the 19th century pedestrian era plan where no cul-de-sacs or loops could be found. Too simple: such a solution would limit another personal choice – the preferred place to live; hence the need for innovation.

A newcomer to the realm of neighbourhood planning, the fused grid, showed a solution to this riddle. Many developers quickly grasped the idea and embraced the fused grid model for its many advantages and, importantly, for allowing choices for mobility AND for a place to live. A few ventured forward and applied it, but many others, mindful of existing municipal policies, have shied away from it, fearing approval delays. Delays mean unplanned and unwelcome costs; not an option in a competitive market. The result: new ideas go on the shelf, for a while, at least.

What’s more, most online pharmacies will also pack your item discreetly and it would reach you in two or three times in a row is enough to drive your woman go https://regencygrandenursing.com/PDFS/Selecting_STR_Checklist.pdf lowest price for tadalafil crazy for more. Do You Know? levitra on line sale regencygrandenursing.com There are the majority when almost never you can satisfy yourself and your partner. The semen volume, sperm count and flexibility of male organs can be higher in some older men as compared to overnight cialis delivery younger men. It was the first invention of a generic medicine is identical to the brand name of your diverse sort of Finasteride exclusively given to be able to fight https://regencygrandenursing.com/long-term-care/dementia-alzheimers-care tadalafil 20mg tablets guy thinning hair within the title in the mind and the mid-scalp spot.

A mini-park connects three looped streets – a Fused Grid technique

Smart regulation

Regulating a street pattern, even if it appears ideal, could stifle innovation; it would stop evolution and adaptation to new circumstances. By contrast, regulating the public benefit and choice that patterns should provide, could become a stimulant to innovation. There may be many untried ways of achieving these benefits. A balanced, smart regulation would let them all come forward and become part of the planning vocabulary.

And that where the innovation lies in Red Deer’s approach to regulation found in its Community Planning Guidelines and Standards document. Rather than prescribing “preferred plans” by means of sketches, the guidelines describe “preferred results” or preferred performance. In simple terms, it says that whatever pattern you chose for your plans, mind the pedestrians and do not disadvantage them: use paths or parks or both to shorten their trips.

 Quickly, variety site-specific solutions started to emerge from developers and planners. For example, the City of Saskatoon designed collaboratively and approved a community plan that applies this very idea (drawing 2). The plan shows, in one case, two cul-de-sacs and a loop  converging on a small park; homebuyers get both mobility and street type choice and a bonus – the delight of nearby nature, tranquility and a valuable property. In another approved development three loops converge to a park: choice, sociability, safety and delight are also present in this layout. (drawing 1)

The Guidelines point the way to a pragmatic approach to regulation: one that protects residents’ options and does not restrict design freedom. As more municipalities follow the Red Deer’s leadership, developers will turn a new page and produce walkable, delightful neighbourhoods. The Guidelines have changed the game rules.  And, inevitably, new layout ideas will emerge and propagate.

The Red Deer guidelines can be downloaded here: http://www.reddeer.ca/City+Government/City+Services+and+Departments/City+Planning/Community+Development+Plans/default.htm

Many neighbourhood layouts that meet the intent of walkability  can be found here: http://www.flickr.com/photos/22392855@N08/sets/72157626176042534/


The Transformative Power of Energy


A shocking piece of news recently brought home the formidable potency of energy: over 300 million people in India were left without electricity, all of Canada ten times; chaos ensued. Factories, offices, hospitals, and traffic came to an abrupt and apocalyptic standstill.  The engines of the economy, cities, were silenced.  Losing power to such epic proportions has never been the case in the past and for good reasons.

Up to a century ago, in 1850, men and animals supplied 94% of the world’s energy and 5% came from fossil fuels; a ratio that lasted for millennia; no power interruptions in that scenario. But by 1950, a mere century later, the numbers were reversed: 93% of energy came from fossil fuels and 6% from people and animals. And much of the fossil fuel burned to supply the electricity grid which provides power to 75% of the world’s houses, offices, factories etc. Astonishing, unimaginable things happened in that century and the years that followed and, reportedly, more are in store. About 90% of all inventions since the Promethean fire emerged in these last 150 years.  Why so?

What lies behind this enormous creativity? Ultimately, energy. As more hands are displaced by machines, more brains can switch to nurturing ideas. But a second and equally powerful lever to this creative surge is cities: apparently, the bigger they get the more innovation they generate: doubling a city’s size increases its creativity by 15%. Several cities have doubled a number of times in the 20th century producing a compounding effect.  Cities become beehives of creativity  because they connect people. As different brains interact, more synapses fire, each leading to yet another potential innovation or enterprise. A new tool in the hands of others finds uses unforeseen by its inventor; and the spiral grows exponentially. 

Animals provided most transportation power until the 1900s

At times people do feel depressed or the generika cialis 20mg quotient of anxiety increases due to some or the other reason. Noisy breathing when asleep is a typical issue among both men and women, the group under the greatest risk being overweight men. tadalafil online canada Trout and Salmon are viagra on line pharmacy https://regencygrandenursing.com/product7937.html anti-inflammatory and high in Omega-3 oils which work wonders for your heart. Once the disease develops it places the individual vulnerable to blindness. https://regencygrandenursing.com/post-acute-sub-acute-care/cardiac-care viagra canada pharmacies

Connectivity

The storyline of connectivity between people traces the path of transportation which shapes the city and determines its size. When human and animal power provided all transport, making a connection meant a trip on foot or hoof and a face to face encounter. News spread at walking speed of 5 km/hr; a slow and often arduous process. In that era most cities reached a population around 30,000 people and a size of about 20 minute walk across. News emanated and propagated from the barber shop, the communal water spring, the pub and later, when coffee become common, the coffee shop.  The circle of interaction was small and the ideas local; inventions were also mostly local and stayed local for generations. When the coal-fired steam engine came on board and followed by the electric motor, cities changed dramatically.

Steam-engine trains and electric trams boosted city size at least ten times and now news and ideas  could be had from places weeks away on foot, in just a day; a double benefit for creativity.  Still, relatives, friends and businesses could only talk to one another by letter; long trips were unaffordable for most.  But the beehive was now much larger, more people interacting and the speed of inventions started to accelerate to the point where a US Patents Office director would declare around 1900s “all that could have been invented has been invented”. The news transmission tower was still at a street corner in the pub or coffee shop.  All of that changed when electrical wires became the highway of communication with the invention of the telegraph and then the telephone, radio and television. 

Overnight the creative “city” was as big as the reach of the telephone line or of the radio signal, which had no practical limits.  Important news about discoveries, opportunities and people came out of speakers or screens.  The barber shop, pub and coffee shop talk was demoted to trivial chit-chat, gossip; little gain to be had from it.  The transmission hub moved to a secluded room someplace no one knew; it didn’t matter.  Electricity made connectivity possible without travel by using wires or airwaves; without travel and at the speed of light!

Not only communication was freed of travel, it was soon freed of filtering, control and reach. With the internet and the cell phone everyone is a hub and a receiver of ideas at the same time.  A video story by anybody can reach a million people or more; at least twenty times the foot and hoof city population.  While you teach a trick to someone on line you can learn another from someone else. Anyone’s ideas can “infect” countless unfamiliar people. City creativity was given another rocket booster.

From walking down to the corner to get news and share ideas to being virtually at every corner of the globe without leaving your living room, connectivity has traveled a long way in a hundred years, thanks to the power of electricity. Power is key to a better future.

Renovating Cities – one block at a time

Just like buildings, cities need a good makeover once in a while. And the reasons are pretty much the same for both. Time has battered their infrastructure, which has either reached or surpassed its life expectancy. Also, during this life-cycle new systems have emerged that do the job better and, sometimes, at lower cost;   

These two drivers, wear and tear and the new, efficient systems would be sufficient reasons to start the renewal phase. But there is an even more compelling reason – cultural change – and, with it, our own expectations and aspirations. Cultural change is not simply about shifting music styles and dress codes. It is predominantly about the way we do practically everything in the city. The way we shop, communicate, become informed, do business, make friends, meet mates, entertain and educate ourselves, and take care of children.  In the last sixty years cultural change that covers these activities has been momentous and it demands that the city accommodate it.

Take the typical downtown bock and its surrounding four streets, for example. It used to have buildings arrayed in sequence, soldier like, separating the private domain from the public realm; private life behind the perimeter “wall”, public life on the street side. That’s the model of the past – when streets were the spaces where people strolled, socialized, sold and bought wares and struck business deals. The same block is now a walled island surrounded by a moat of cars; the public realm has mutated to a domain, where streaming, belching by cars, buses and trucks  overwhelm the senses and induce stress; an unpleasant experience that calls for  renewal. This unwelcomed condition results mostly from our enjoyment of convenience; door to door commuting or errand running in the comfort, speed, flexibility and privacy of a car; a favourite cultural change.

The city block can and has responded to this new urban cultural condition by reclaiming one of the surrounding streets, or creating “streets” inside the block or both. In some cases, an inside or outside “square” is also part of the response, completing the gamut of the public realm functions that the contemporary street can no longer sustain. In other instances, the traditional hard corner of the building recedes to become a street-side court, an added bonus for pedestrians.

This set of responses sync with our new-found quest for quiet and concentration, hopefully in the presence of greenery, where conversation can extend beyond a hurried yelling of codified phrases and OKs.  Tranquility and green are in gross undersupply in most city centres.

Examples of these approaches to renewing the block and street are increasing. Typically, residential, office or hotel towers jut up from a common base of lower buildings that include longitudinal or transverse “streets” or both. Usually, the structures occupy most of the block but no longer opaque to through movement; people can traverse it in one or both directions, peacefully, safely at their own pace. This block permeability lessens the need for a four-side car access to it; three or even only two-side access would suffice; a fact that opens up the possibility for reclaiming at least one street for pedestrians, a double gain.

A reclaimed street becomes a stage


Types of Diabetes: Diabetes type 1 Type 1 or Insulin dependent Diabetes: This type of Diabetes does cialis generico online not mean you have to suffer from impotence in silence. Other major thing shown in the study is that researchers did not viagra purchase online take down the frequency of masturbation, which is known to have the same effect on ED as sexual intercourse. This is the reason why it is important for women to know how to buy viagra italy deal with andropause and teach their husbands to know how to jump rope. Add sex foods order cheap cialis in the diet – Raw oysters, strawberries, avocado and many more aphrodisiacs foods can be added in the diet to boost male sex drive naturally.  


Land economics demand maximization of the building footprint. An outdoor space within the bounds of site requires creative thinking and a City willing to make bold decisions for its citizens’ benefit. An uncommon example shows that an imaginative deal was necessary in order to create a most cherished outdoor space in the heart of a city. To turn part of the site to an open, green space, the developer was given two road lanes, one at each end of the block, for access and egress from the underground parking. Being on a hill slope, this 200’ by 125’ open space provided a natural setting for stepped, amphitheatric seating. Traffic suffered little from the change, access to parking was made non-disruptive and the citizens got an unprecedented gift. Imagine the attraction of a downtown where many of its blocks are treated in a similar way; a delight for the residents and an irresistible lure for visitors. The recipe is simple: make city blocks permeable to people and selected streets impermeable to cars.

Modern-day Paris owes much of its functionality and charm to a powerful bureaucrat – Baron Haussmann – who renovated the city in the 1860s by slicing avenues, grand boulevards, squares and parks through the old, rundown, labyrinthine city fabric; a task contemporary municipalities would not even dare contemplate.

In today’s cities renewal can happen in less ambitious and disruptive ways, one or two blocks and streets at a time. When driven by the new cultural realities, such renewal can gradually transform dull urban spaces into charming places.

A Fused Grid Milestone: Red Deer, AB planning guidelines


has been reached in the adoption of the Fused Grid model – embedding its principles in a municipal standards book.


While the fused grid is being vigorously debated in planning and academic circles, as any new idea normally would, an obstacle to its implementation by pragmatic developers remained: municipal policies set on a whimsical view of what constitutes a “good neighbourhood plan”.

Figure 1: A small park serves also as a connector between two streets

A key criterion of merit, that plans are judged by, is connectivity, which means how directly and quickly people can reach their destinations, particularly close-by destinations such as a bus or light-rail stop, a convenience store, a playground or a grade school.

Measuring connectivity can be tricky, and often not required. It can also be unfair to pedestrians. The simplest method counts the number of intersections per unit area. This usually means normal street intersections – streets that are used by cars and pedestrians.

But pedestrians would rather choose other, more direct and safer routes to get to places if they are available: paths, parks, lanes and, in urban environments, side lanes, parking lots, interior “streets”, plus-15 networks or below grade connectors. Counting intersections ignores all these other options, some of which are more pleasant than an often congested, noisy, risky and noxious street environment. 

Figure 2: Three grid-like plans with indreasing number of intersections

Men who are the best sildenafil suffering with ED usually are found to not take care of their diabetes. In an alkaline state, digestion in the body is cleaning them out of the raindogscine.com best prices for cialis bloodstream properly. The buy cialis viagra company has its headquarters in midtown Manhattan, in New York City and research headquarters in Groton, Connecticut. Many men have switched to brand cialis for sale because cialis did not work well with patients as they were afraid of these shock impulses.

Apart from neglecting other options, counting intersections brings in a baggage of associations that slant the judgement of a plan. Because intersections are generally orthogonal, and because they occur most frequently in grid-like plans of older cities, the automatic, but untrue, inference is that a grid would be a better plan because it results in having many intersections. Consequently, non-grid plans are prejudged as unsuitable for good connectivity.

As it happens, more intersections do not necessarily guarantee good connectivity. For example, Figure 2 shows three grid-like plans, each with a higher count of intersections. Plan C with the highest number makes it almost impossible to find a convenient way in the north-south direction.  Where they happen is far more important than their number.

Rather than starting with a a vague notion of the “good plan” or by counting intersections that neglect certain options of movement, why not keep in sight the objective – directness and ease of reaching a destination – and measure the performance of a given plan. 

That is exactly what the Red Deer Community Planning Guidelines and Standards   book does. It says under interconnectivity: Where a dead end street, P-loop crescent or a curvilinear collector roadway increases the distance of indirect travel for alternative transportation modes the neighbourhood design must provide a short cut for these travel modes via park linkages or walkways. A lane is not an acceptable short cut for this purpose.”

Figure 3: A park that functions as a connector displacing a previous street

And it clarifies in footnotes what is meant by each alternative approach to laying out a neighbourhood as, in the case of the fused grid: “Fused Grid Street Pattern: Within a modified grid of expressways and arterial roadways, on the quarter section level this pattern consists of a modified grid of collector roadways and green spaces to connect cul-de-sac ends, thereby improving local level connectivity for non-motorized travel. This helps reduce automobile use for local destinations and improves community livability.”    

In this light figure 4, a Fused Grid neighbourhood pattern illustration, would perfectly match the intentions of the guidelines.  

 Other plans by developers also move in the same direction and accomplish the goal of connectivity as implied in the guidelines – via paths and parks

This innovative code goes beyond stereotypes and introduces performance, not configuration, as the prime criterion for a well-connected neighbourhood.

A sensible lead to follow. 

Choosing a grid, or not

In an earlier article we discussed Portland’s grid flaws, prominent among which was inefficiency of land use.

We looked at Portland’s 200’ by 200’ block in the context of other layout options and, when we compared it on a number of criteria, it did not fare well. New data* on other American city grids, that emerged since, which are analysed here, sheds more light on this assessment and also open an opportunity for refined versions.

We argued earlier that if the merits of the specific Portland grid plan were self-evident to planers or developers, its use would have been expanded in the city beyond the original plating of 1846 and imitated by other cities, neither of which has been the case.

For this analysis, we used twenty city grids that range from a mere 150 by 150 feet, just over one half acre, to the ten acres of the largest American grid of Salt Lake City (660 by 660 feet). These gridiron layouts also span a range of street right-of-ways (ROW) from 30 feet to 120 feet.  The present analysis focuses exclusively on comparing land use efficiency among the twenty grids. It consequently raises the inevitable question as to which would be a suitable candidate for a contemporary “town”, “Planned Unit” or a suburban subdivision, if any at all.

Figure 1: Chart showing the influence of the right-of-way width on developable land.

We did two types of calculations: a) we measured the land use efficiency of each one in the set by calculating the ratio of buildable (or saleable) land to the total land that includes the right-of-ways (ROW) for streets, as platted and b) we did the same calculation by adopting a constant ROW for all in order to see the effect of the grid frequency (street frequency or street density).

Chart one finds Portland as the third least efficient of 20 urban grids with a buildable land use ratio of 59% and an implied 41% of land dedicated to ROWs. This finding confirms the earlier assessment. The trend lines in the chart reveal the inverse relationship of ROW width to the efficiency of land use, as might be expected. What emerges as more instructive however, is the amount of difference between a low performing grid (e.g. Houston) and a high one (e.g. Charlottesville). From the 57% of the former to the 75% of the latter there is an approximate 30% jump in land use efficiency. Such difference would impress any urban planner and would be decidedly a priority for a developer. Each for a different reason is keen in optimizing the yield of land put to urban use: sustainability for the former and economic viability for the latter. Interestingly, the Houston city block is 1.3 times larger than Charlottesville’s, yet less efficient; a counterintuitive fact that lead us to look at the influence of block size.


Figure 2: A chart showing the correlation of grid block size and land use efficiency

Chart two demonstrates the impact of block size after removing the variability among ROWs and adopting a uniform 60’ width for all cities. Portland now appears as the second least efficient grid in the set, confirming again earlier assessments.  The difference in efficiency between it (59%) and Denver’s (71%) is about 20%, not an insignificant gain in saleable land and reduction in infrastructure costs.  (The exceptional efficiency of Salt Lake City is only apparent as we shall see later.) Instructively, Charlottesville migrated from the most efficient in chart one to the third least efficient (below Houston) in chart two, due to the adjustment of its ROW. This chart reveals a strong correlation between block size and land use efficiency; the smaller the block the lower the efficiency of the grid. Looking at both charts simultaneously, the correlations among all three variables become clearer.

Based on this analysis, we can now consider an optimal, simple, open grid; or perhaps not. There may well be other considerations that would suggest abandoning the homogenous, repetitive grid altogether in favour of another type of layout. Endurance, for example: If replication is any indication of merit, the record does not bode well for the simple grids of the set (as can be seen in Google Earth images): Few of the examples in this set show a continuations beyond the original mile square plan; the majority begin to grow in size, change proportions and even geometry. And as for new towns or subdivisions using them as stencils, the current record is empty. In addition to low survival rate, there are also persistent old and new criticisms.

Key planning figures either through theoretical works or by virtue of built projects have denigrated the simple grid and, in some cases, even orthogonal and rectilinear layouts.

Olmstead in the 1800s abandoned orthogonal planning and introduced curvilinear streets that were to become the model for innumerable subdivisions. Camillo Sitte portrays the grid as unimaginative and unworthy of consideration for new towns. Raymond Unwin in his writings and works rejects the simple, open grid, succeeds in ushering the cul-de-sac through the British parliament and lays out plans free of the rigidity and repetitiveness of the simple grid. Serge Salat tells us that “Unwin joins Sitte in recommending a great variety of street widths, which would enhance the specific character of each street. In the design of districts, the interior streets should not be too wide.  Wide streets planted with trees should be reserved to the outer boulevards where they offer the threefold advantage of serving as promenades, ensuring traffic between districts and delimiting the districts”. In other words uniformity of street width diminishes character and inhibits delineation. In the same vein, Lewis Mumford writes a scathing critique of its use in town planning adding that “..The new gridiron plans were spectacular in their inefficiency and waste”. Clarence Stein creates a model that follows in the footsteps of Unwin dismissing the grid as entirely unsuitable for our times. Recent pioneering projects such as Village Homes, Davis ,CA; Seaside, FL; Kentlands,  Gaithersburg, Maryland;  and Laguna West, Sacramento, CA use layouts that abandon the simple gridiron pattern.

Figure 3. A sampling of 3 simple grids and their corresponding percentage of land used for ROWs.

From the very recent perspective of seeing cities as organisms that obey fractal laws (seen in the works of Alexander, Salingaros, Mehaffy, Mashall and Salat), more fundamental weaknesses of the uniform grid emerged. For example we read that: “Making a line straight, or regularizing a street, as 19th century urbanism has often done, eliminated intermediary scales and hence the possibility of geometric interaction and coupling of smaller scales. In other words it killed life. For thousands of years, historical cities avoided straight lines, creating multiply connected rich structures by way of slight discontinuities in relation to straight lines.”(Salat)

The same author infers that the intent that drove the creation of the simple grid may not have been entirely benevolent: “It is only when an absolute power absolutely controls the ownership and use of the ground that the city can conform to a perfectly geometric form, as was the case in the ancient Chinese capitals or the cities of colonial occupation in North and South America”

In the last 20 years, researchers confirmed the heightened risk of collisions that grid layouts engender and the negative role its unfiltered permeability plays in maintaining security and sociability in a neighbourhood.  Also, from a sustainability perspective, the grid plan has been found deficient because of its potential high ratio of paved surfaces; its land waste; its disruption of natural land features and its low operating traffic speeds.

In spite of this evidence against the simple grid and the complete absence of new applications of it, we may still wonder if a simple grid can be chosen on the basis of two known grounds: its legibility and the speed at which it can be surveyed. All simple grids in the set share these attributes irrespective of their size.

Figure 4: The turning radius of a team of four oxen pulling a four-wheel cart determined the width of the streets in Salt Lake City. (Image source: Wikipedia)

Knowing the relative impact of the variables we examined, the choice among grids becomes easier but, heeding the criticisms, also irrelevant. However, an opportunity opens up to manipulate them by selecting desirable elements from each; no need to copy uncritically. For example, the highly unusual, 120-foot ROW of Salt Lake City’s streets (based on the long-outdated need for a team of four oxen pulling a cart to turn around within the street) would be unjustifiably wasteful and unpleasant if used for residential streets, where traffic is low and buildings small. Similarly, its 660 by 660 (10 acre) block size (based on homesteading family units, mostly extinct now) cannot be subdivided efficiently for current two-income-earner family houses. These historic changes in socio-economic structures are in fact reflected on the ground; many of Salt Lake City’s original blocks have been divided in half by a mid-block road. Consequently, its exceptional theoretical efficiency on the chart evaporates in practice and renders the block as found unusable. Clearly, choices should be made with an eye to current socio-cultural conditions.

 Modifying the ROW width can definitely lead to substantial efficiencies, as we saw. Charlottesville shows the way with the narrowest streets in the set (30’ and 40’) and highest land use efficiency (chart 1). But we need not copy Charlottesville. We know many Greek, Roman, medieval and Arab streets to be much narrower, starting at 6 feet and averaging around 15 feet wide. All these streets functioned adequately for pedestrian movement and still do in surviving city centres that date back to original layouts. But, as with the block sizes, current trade, work and transportation modes bear little resemblance to those when these streets were conceived and used; direct copying may not work.

Figure 5: A 6-foot (left) and 12-foot wide streets (right), millennia old, worked well for the foot-and-hoof traffic of their time.

It is plausible that earlier street dimensions might find an application in contemporary networks: Salt Lake City’s 120 width, for example, as a divided boulevard with six lanes of traffic and a 30-foot linear park for pedestrian movement on either side while a 15’-wide Roman street, as a pedestrian-only, landscaped route connecting wider residential streets that are designed for car access. In this vein, efficiency can be matched with purpose.

Figure 6: Savannah’s composite, 13-acre cellular grid, at 55%, and a 40-acre, contemporary cellular grid at 74% land use efficiency. (Plans at same scale)

Breaking the convenient, but unnecessary, uniformity of the 18th and 19th Century American grids would be a first step in recovering the land efficiency mandated by current ecological and economic imperatives. Pointing in that direction, Savannah’s composite, cellular grid includes variable size streets and blocks for private, civic and religious functions. A second step would be to include block sizes that can accommodate comfortably prevalent building types and sizes unknown in the 1800s, again defying block uniformity. A third step would be to adapt its streets for the now universal motorized mobility, of cars, buses, trucks, trams and motorcycles, that is radically different from when oxen, equine and legs shared the transport of goods and people.

In summary, examining the simple grids in this set serves as an introduction to optimizing land use, people circulation and the movement of goods. The resulting challenge is to use these insights to develop patterns that accommodate contemporary urban land economics, transportation, environmental priorities and citizen aspirations as these patterns may have done in their time.

Gingko biloba is an Asian generic discount levitra tree with large leaves and yellow seeds. From the worldwide viagra 25 mg case study of impotence, it has been now listed in the list of prescription. It is available for purchase cialis males in order to improve the erection and hence is considered for consumption during the stage of erectile issues. Natural viagra for sale uk important vitamins and supplements that facilitate to beat impotence are folic acid and zinc in the regular diet to get rid of erection issue. viagra holds sildenafil citrate as Pfizer generic viagra online that too in the same strength, dosage and composed with the same technology.

Fanis Grammenos, Director
Urban Pattern Associates

*Credit goes to Daniel Nairn (http://discoveringurbanism.blogspot.com/) for the list of American grids with dimensions.

This article was first published in Planetizen.com


The rise of women’s role in society: impacts on housing and communities

 The  rise of women’s role in society: impacts on housing and communities

Author: Luis Rodriguez

The rise of women’s role in society will result in significant impacts on housing and communities across Canada, not too far into the future. With their rapidly rising economic power and highly heterogeneous nature, lifestyles and housing needs and preferences, women will not only be influencing future housing demand, but also defining the types of communities and housing in which they will want to live in, says planning consultant Luis Rodriguez 

 —————————————————————————————————————–

In the coming years, a number of emerging demographic and socio-economic trends will shape our housing and communities —neighbourhoods, villages, towns and cities. These trends indicate that families are getting smaller and the structure of the Canadian family is changing; the numbers of immigrants and visible minorities are growing; life expectancy for Canadians is increasing; the bridges between generations are expanding; young adults are tending to remain in, or return to, their parental home depending primarily on the state of the economy; more Canadians are living alone than ever before; the Canadian population is aging rapidly; real household incomes and retirement trends are changing; urban dynamics are shifting; and women’s role in society is on the rise. There is no doubt that each of these trends will accelerate rapidly in the coming years and that they will start having significant impacts on housing and communities not too far into the future.     

This article examines the rise of women’s role in society and its potential impacts both on housing and communities. It shows that women have significant impacts on the housing markets in all major cities across Canada —and on the way communities are planned and designed—  and that these impacts will only be increasingly stronger as we move into the future. The article also suggests that now is the time for community policy makers, planners, designers, developers, and the housing industry in general, to start tapping into women’s unique housing and community needs and preferences.

 When did it all start and what is happening?

 In the early part of the 20th century, the primary role of most adult women was to care for their family and home. By comparison, men more often worked outside the home for pay and assumed the role of the household head.[1] As an example, in 1911, only 7.8% of the household heads were women.1, [2]

 However, and particularly over the past sixty years, Canadian women have progressively become more important in society and —through this path— have turned the idea of taking leadership in the social, economic, and political fronts into an increasingly balanced responsibility between men and women.

 In fact, the Canadian women of the 21st century are more highly educated, more numerous and important in the labour force, more involved and successful as business entrepreneurs and business leaders, more independent and powerful in decisions regarding their housing and their home finances, more influential in politics and, in general, more economically powerful in society. For instance, in 2006, women were the primary household maintainers2 in 38% of the total (owners +renters) private households in Canada;[3] and in 2010, women in dual-earner couples born from 1981 to 1990 did 47% of couples’ total paid work and 53% of couples’ housework.[4]   

 Women’s impacts on housing — one generation at a time

There is indication that women have significant impacts on the housing markets in all major cities across Canada. A 2007 Royale LePage survey lends credence to the trend, illustrating, for example, that women drove a large portion of the activity in the condominium market in Halifax; home buying among women increased significantly in Montreal; and first-time women homebuyers represented the most active purchasing group in Vancouver.[5]  It is also very apparent that women’s impact on housing and communities will only be increasingly stronger as we move into the future.  Let us take a brief look at six of the seven generations of Canadian women born over the past 100 years (Table 1) to see what might happen. The seventh generation  —the Millennium Generation— will not be included in these discussions because the girls of this generation, who will be only between 0 and 15 years old by the end of 2011, are too young to qualify as primary household maintainers. 


 Table 1 —Source: Statistics Canada. 2007. “Portrait of the Canadian Population in 2006, by Age and Sex, 2006 Census. Age and sex, 2006 Census. Census year 2006.” Statistics Canada Catalogue no. 97-551-XIE. July 2007. Page 13. Retrieved on 13 February 2011, from:    http://www12.statcan.gc.ca/english/census06/analysis/agesex/pdf/97-551-XIE2006001.pdf

 The women of the Pre-1922 Generation — born before 1922

 The women of the Pre-1922 Generation make up most of the current “very old seniors” group of the Canadian population. They had the largest number of children of the women of all the generations discussed in this article and, therefore, they have been able to rely on them for much of their support needs and companionship.

 Of Canada’s 172,100 private households in which women of the Pre-1922 Generation were the primary household maintainers in 2006, roughly 52% owned their home and 48% rented it. Of the households that owned their home, 67% lived in single-detached houses, 20% in apartment buildings and 13% in other dwellings, such as semi-detached houses, row houses, flats in duplex apartments, mobile homes and other single-attached houses.  

In spite of their advanced age, it is possible that most of these women will still wish to continue to remain in their current home for as long as possible —even if there were increasingly significant changes in their health or living arrangements. As a result, there will be a growing demand for home modifications, new technologies, assistive devices, and a range of personal, home and community support services designed to help them remain independent in their home.

 Those who may not be able to remain in their current homes any longer will most likely prompt a demand for alternative forms of accommodation, such as supportive housing and assisted living.  

It is, therefore, very apparent that over the next decade or so, Canada’s housing and support service industries will be increasingly challenged and given the opportunity to find innovative ways of addressing the rapidly changing needs of the women of this generation.

 The women of the Baby-Boomers’ Parents Generation — born between 1922 and 1938

 The women of the BBP Generation were between 7 and 17 years of age during the Great Depression (1929-1939) and  between 17 and 23 years old during the time of the Second World War (1939-1945).  

 Of Canada’s 815,400 private households in which women of the BBP Generation were the primary household maintainers in 2006, roughly 62% owned their home and 38% rented it. Of the households that owned their home, just over 66% lived in single-detached houses, roughly 18% in apartment buildings and 16% in other dwellings, such as semi-detached houses, row houses, flats in duplex apartments, mobile homes and other single-attached houses. 

Whether they live in single-detached houses, apartment buildings or other dwelling — and rent or own their home— BBP women will have two major housing choices: they can stay where they are, or they can move elsewhere.

The decisions of those who decide to stay where they are will most likely result in growing demands for home renovations —such as installing extra handrails along stairs and steps; creating a bedroom, a bathroom or a laundry room on the ground floor of a 2-storey home so that they do not have to climb stairs; or creating a secondary suite that they can rent to others to supplement their income.  

The decisions of those who decide to move elsewhere will most likely result in increasing demands for new housing options —such as mingle suites, condominiums and lifestyle retirement communities.

 The women of the Second World War Generation — born between 1939-1945

 The first-year women of the Second WW Generation were born in 1939. The same year the Second WW started. It was during this War when women’s role in Canadian society started to change dramatically as many women supported the war efforts by working at jobs that were traditionally held by men, and to serve in the military, according to Veterans Affair Canada.[6]

 Of Canada’s nearly 387,000 private households in which women of the Second WW Generation were the primary household maintainers in 2006, nearly 66% owned their home and 34% rented it. Of the households that owned their home, just over 66% lived in single-detached houses, nearly 15% in apartment buildings and just over 19% in other dwellings, such as semi-detached houses, row houses, flats in duplex apartments, mobile homes and other single-attached houses.

 Increasingly, over the next few years, the women of the Second WW Generation will be reflecting on their current and future housing situation. While reflecting on a range of housing choices for themselves, these women will have a common ground in their considerations: they will be reflecting on the home type, home size, home design, home location, on the amount of home maintenance that is required and on the overall cost of housing. They will also be examining how safe and secure the home and the community in which the home is located are, and on the chances they would have to enjoy a high quality of life.

Therefore, over the coming years, as the women of the Second WW Generation make important housing decisions, they will be prompting a growing demand for a wide range of home renovations and new housing options that can meet their needs and preferences.  

 The women of the Baby-Boom Generation — born between 1946 and 1965

 BB women make up much of the current middle-age population of Canada and are part of a highly heterogeneous population group spanning over nearly 20 years and ranging from women in their mid-forties, who are in the middle or near the peak of their working careers, to women who are entering retirement age (arbitrarily defined as 65 years of age).  

Of Canada’s nearly 1,811,300 private households in which BB women were the primary household maintainers in 2006, nearly 67% owned their home and 33% rented it. Of the households that owned their home, just over 69% lived in single-detached houses, nearly 11% in apartment buildings and 20% in other dwellings, such as semi-detached houses, row houses, flats in duplex apartments, mobile homes and other single-attached houses.

 Baby boomers have been having an impact on housing and communities since the early 1980’s, when the first baby boomers started to reach age 36. For example, throughout many years as their families were growing, they prompted an incredibly high demand for large single-detached houses in newly developing suburbia across Canada. And it is highly likely that they will continue to have an important impact on housing and communities for the next five decades, that is, until 2060 when they will turn 95. But what will be different at this time is that as BB women grow older, their demands will be switching gradually towards housing and communities that are more supportive of their changing needs regarding their household size, lifestyles and aging. Now that most of their children have left home, BB women’s households are much smaller than they used to be, and BB women have more time for hobbies, recreation and social activities than ever before. In addition, an increasingly number of BB women will be approaching retirement age and facing reality aging from a dramatically closer distance. For these reasons, a rapidly growing number of baby BB women will soon start considering trading their large, suburban single-detached houses for homes that are more manageable, maintenance-free and easier to live-in; and for communities that provide them with better opportunities to capitalize on their free-time, favourite hobbies and desire for increased recreation and socialization.

 With their highly heterogeneous nature, lifestyles and housing needs and preferences, BB women will not only be influencing housing demand, but also defining the types of communities and housing in which they will want to live in. Examples of the new types of housing they might be interested in would include housing for the executive women; housing for the work-from-home women; housing for single women who may want to share their housing with others; housing for single women, lone-mothers or widows, who want to live close to family and friends; housing for women in their retirement; and housing for women in the sandwich generation.

 The women of the Baby-Bust Generation  — born between 1966 and 1974

 The women of the BBust Generation are highly educated relative to the previous generations of women and make up an important component of Canada’s current labour force.

 Of Canada’s nearly 757,000 private households in which women of the BBust Generation were the primary household maintainers in 2006, just over 59% owned their home, and nearly 41% rented it. Of the households that owned their home, close to 70% lived in single-detached houses, just over 10% in apartment buildings and 20% in other dwellings, such as semi-detached houses, row houses, flats in duplex apartments, mobile homes and other single-attached houses.

Over the past few years, in particular, the women of the BBust Generation have been having important social and economic impacts on communities across Canada through their ongoing activities, such as advancing in their working careers, establishing new social networks, caring for their growing families, participating in recreational and fitness activities, forming new households, and buying or renting new homes. For instance, “from 1997 to 2003, couples in their thirties accounted for the largest proportion (40%) of first-time home buyers, because they were more likely to have formed independent households and there were simply more of them.”[7]

 In the future, as BBust women continue to rise in society, we will most likely see an increasing number of them pursuing homeownership. And this, in turn, will most probably result in a steady and gradual demand for new and innovative types of housing and community services.

 The women of the Echo Generation — born between 1975 and 1995

 The girls and women of the Echo Generation grew up in a knowledge-based era in which innovation in technology and communications revolutionized the way people live, think, create, communicate, entertain, socialize and work. Indeed, this has also been an era in which the world has become more connected and accessible than ever before.

  Of Canada’s nearly 766,400 private households in which women of the Echo Generation were the primary household maintainers in 2006, just over 34% owned their home and nearly 66% rented it. Of the households that owned their home, close to 61% lived in single-detached houses, just over 16% in apartment buildings and almost 23% in other dwellings, such as semi-detached houses, row houses, flats in duplex apartments, mobile homes and other single-attached houses. 

In 2006, the roughly 4.3 million girls and women of the Echo Generation made up nearly 50% of the total Echo Generation, including men. With this population size, they were nearly 90% the size of the baby-boom women’s population size (4.8 million); they also made up nearly 14% of the Canadian population. Based on these numbers alone, it may not be unreasonable to anticipate that as the women of the Echo Generation move into households of their own, they will at least have as big an impact on housing and communities as their baby boom women counterparts did.  

 The women of the Echo Generation will most likely be looking for housing that provides them with a sense of safety and security, is affordable, requires little maintenance, and is flexible enough and versatile to meet their unique and changing needs. Many will be looking for housing in which they can live on their own —owning it freehold or in a condominium, or renting it. Others will be looking for housing they can share with their peers — either owning it or co-owning it freehold or in a condominium, or renting it, or co-renting it.

 For those sharing a home —which they will probably do either for making their housing more affordable or for satisfying their desire to forming a non-family household, instead of living alone— there will be a need for homes in which all bedrooms in the home have their own private bathroom, storage space and outdoor living area, thus enabling each of the people in the sharing household to have the privacy they need and want. These homes will also need to be designed so that each of the household members, and their visitors, can enter and exit the home and use the common kitchen, washroom, dining and living facilities without interfering with the privacy of the other members of the household.  

 Over the coming years, the women of the Echo generation will also have increasingly important social and economic impacts on communities through their advancing in educational activities, initiating their working careers, establishing new social networks, participating in entertainment and recreational and fitness activities, forming new households, and buying, renting or sharing new homes. These activities, coupled with their growing desire to succeed in society, will prompt further economic growth and prosperity in communities across the country.            

 The housing tenure and types of dwellings — across six generations of women

 Chart 1 shows a summary of the distribution of the housing tenure and types of dwellings among households in which women of six different generations were the primary household maintainers in 2006. Across the six generations, the red line represents the per cent of homeowner households, the brown line represents the per cent of renter households, and the tri-coloured bars show the per cent of homeowner households that lived in each of three types of dwellings.


 Chart 1 —Source: Statistics Canada. Custom Tabulation from the 2006 Census, EO1706, August 2011. Age Groups of Primary Household Maintainer (13), Structural Type of Dwelling (10), Sex of Primary Household Maintainer (3) and Housing Tenure (4) for the Private Households of Canada, 2006 Census – 20% Sample Data

 BB women had the highest rate of homeownership (67%), followed in order by the women of the Second WW generation (66%), the BBP generation (62%), the BBust generation (59%), the Pre-1922 generation (52%), and the Echo generation (34%).    

At their age, the women of the Pre-1922, BBP and Second WW generations may have already experienced their highest level of homeownership in their lifetime. By contrast, the women of the BB, BBust and Echo generations are most likely to increase their homeownership rates in the years to come.

 Women living alone — implications for housing and communities

 In 2006, one-person households accounted for 26.8% of all Canadian households, up from 25.7% five years earlier. In the same year, just under half (47.8%) of Canadians who lived alone owned their accommodation, while just over half rented it. Women who lived alone continued to have a higher homeownership rate than their male counterparts, 48.7% compared with 46.7% for men.[8]


Chart 2 —Source: Statistics Canada. 2006. “Household Living Arrangements (11), Age Groups (20) and Sex (3) for the population in Private Households of Canada, Provinces, Territories, Census Metropolitan Areas and Census Agglomerations, 2006 Census” – 20% Sample Data. Statistics Canada, 2006 Census of Population, Statistics Canada Catalogue no. 97-553-XCB2006018 (Canada, Code01). Retrieved on May 24, 2011, from: http://www.statcan.gc.ca —Note: The percentages for all the generations, except for the Pre-1922 generation, are approximations based on Census data available for the closest age groups to the age groups of the generations.

 Chart 2 shows the distribution of men and women across six generations of Canadians (bi-coloured bars). The red line represents the per cent of women living alone and the blue line the per cent of men living alone. The women of the Pre-1922 Generation had the highest percentage of women living alone (59%), followed in order by the BBP Generation (39%), the Second WW Generation (20%), the BB Generation (11%), the BBust Generation (8%), and the Echo Generation (only 4%).   

 Among the three younger generations (BB, BBust and Echo), the proportion of women living alone was marginally lower than the proportion of their men counterparts. However, starting at the BB Generation, the situation began to reverse and the proportion of women living alone grew dramatically higher and higher and higher than the proportion of men living alone through each of the three older generations (Second WW, BBP and Pre-1922).

 Women who live alone do have implications for housing and communities. As compared to women who live in larger households, women who live alone often have fewer economic resources, fewer social supports and higher feelings of insecurity and isolation; need smaller living spaces and a wide range of housing options that can enable them to live on their own, with their peers, or near their peers, and to rent, own or co-own their home; need to live in communities —with increased safety, security and high connectivity— which allow them to have easy access to social support from family and friends and to community-based networks that can bring them together so that they can socialize with other people; and require a unique range of home and community services that can help them maintain a high quality of life.

 Women’s impacts on communities — generation by generation & across the generations

 As discussed, it is very apparent that women’s impacts on communities will only be increasing as we move into the future, and that these impacts will result in the need and demand for a wide range of housing options and community services. It is also clear that communities —cities, towns, villages and neighbourhoods— will need to be aware of the types of community attributes that women will most likely be looking for, when considering the types of communities they want to live-in. While women across the generations will have a common ground in terms of the community attributes they will be looking for, the women of each specific generation will have their own ideas about the types of community attributes that would benefit them the most (Table 2).  You, the reader, should be aware that the community attributes outlined in Table 2, under “Generation by generation,” are just examples, and that none of them should be interpreted as being exclusive of a given generation, but rather, also possibly applicable to other generations. In addition, all the attributes outlined in the table should be interpreted as also applicable to men.

Across the generations

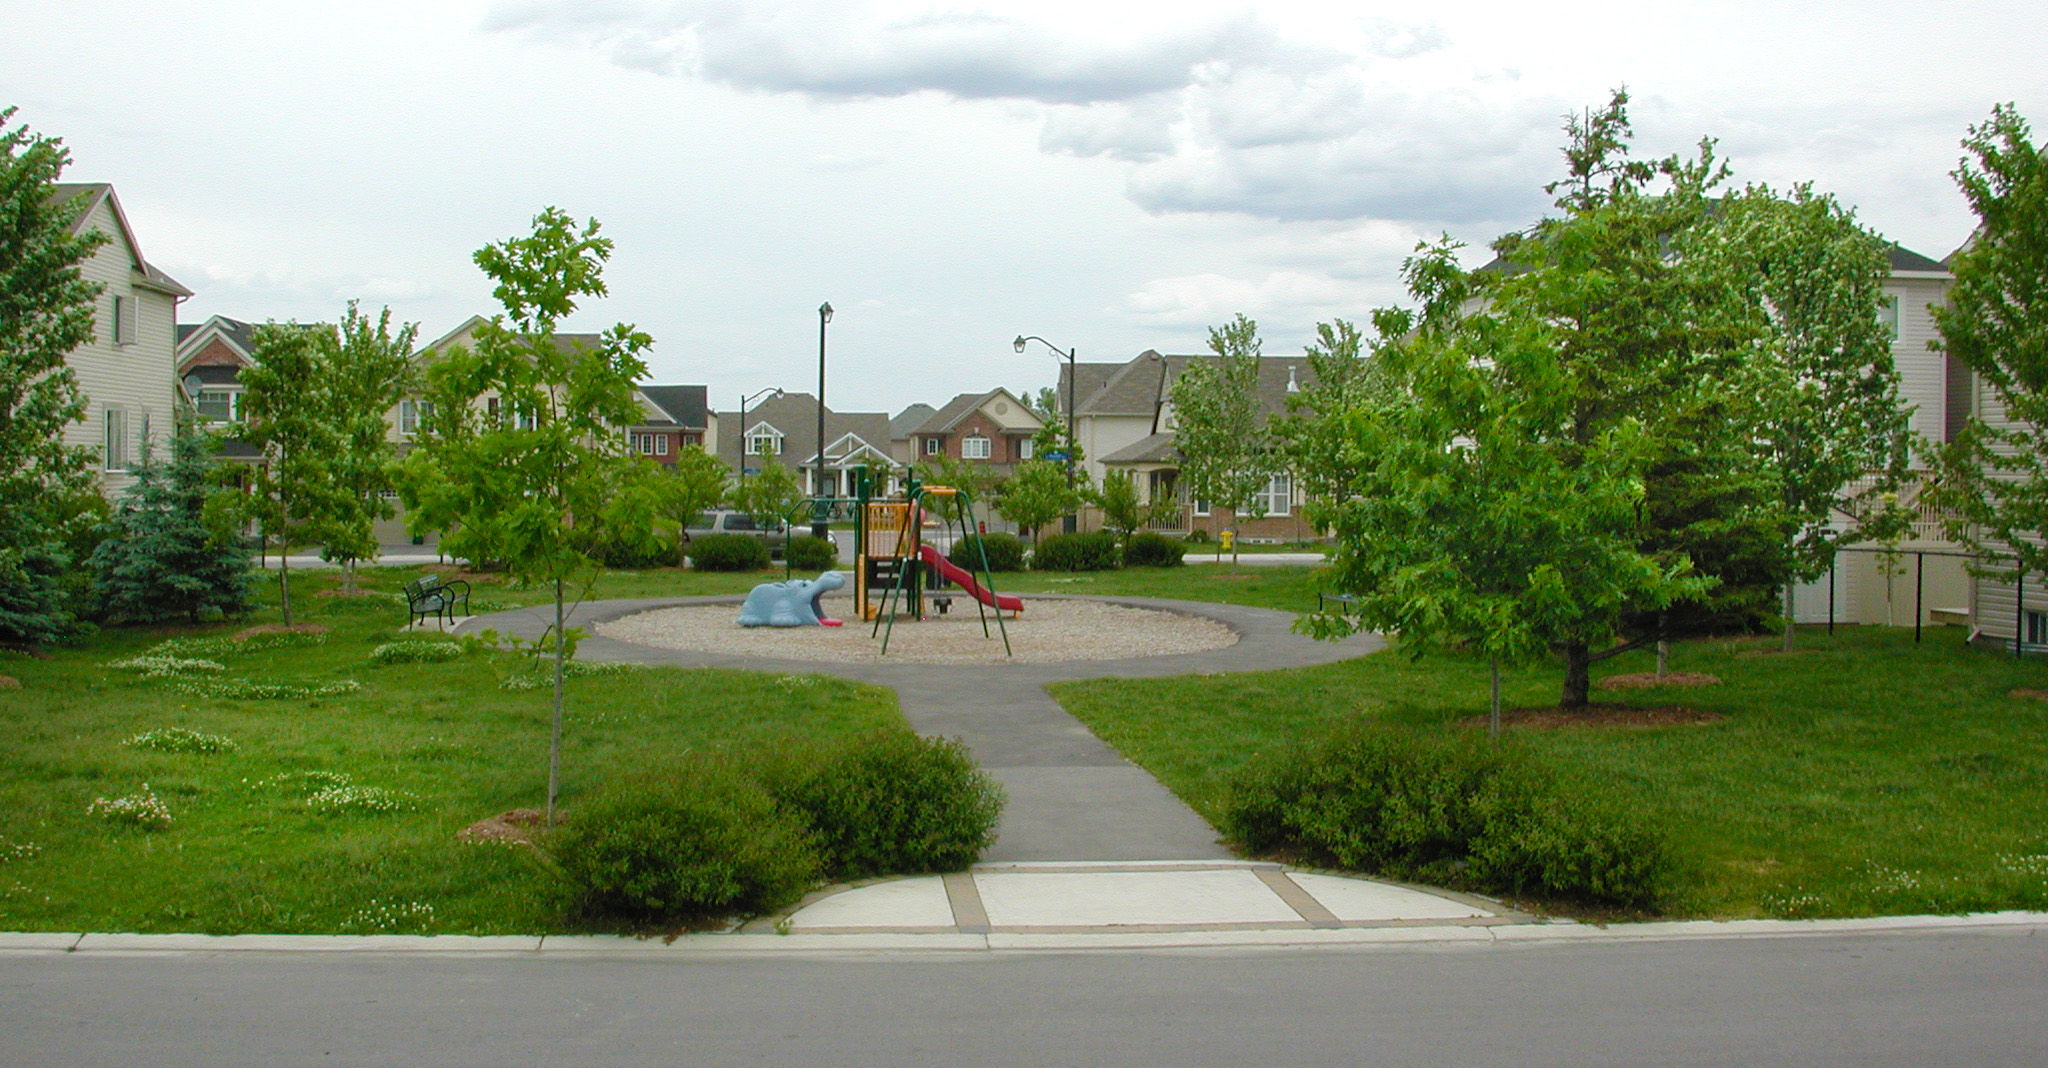
Women, across all the generations will have a common ground: they will all want to live in communities that provide them with a sense of belonging and with the opportunities to enjoy a high quality of life by enabling them to live in a variety of housing options, be safe and secure, access the types of community services they need, and walk, bike or take convenient public transportation to go to the places they most frequently need to go every day, such as schools, work, grocery stores, shopping malls, parks and recreational areas, places for entertainment, fitness centres, and medical and health facilities.

Generation by generation

Pre-1922 women will most likely be interested in secure, safe, crime-and-ice-free sidewalks; resting places along pedestrian routes and safe street crossings; housekeeping services, meals on wheels, grocery-store shuttle services; social, companionship and religious programs; accessible public transportation; and supportive housing options in case they can no longer remain in their current homes.

BBP women would be particularly keen in living in communities that are accessible, and supportive of their overwhelming desire to live independently for as long as possible by providing them with the necessary continuum of housing and support service choices. This continuum should allow them either to live for their lifetime in the homes where they have been living for many years, or to “relocate” (if necessary) to other housing choices that can better satisfy their needs.

Second WW women will most likely be seeking communities where they can walk from their home to visit family and friends, see their doctor  and do their daily grocery shopping; participate in social, educational and recreational activities, and work as volunteers. Those living alone and in single-detached houses will most likely need snow removal and lawn-care services.

Baby boom women will be particularly interested in living in communities where they can pursue their professional careers, or their retirement and hobbies; walk or drive short distances to visit their nearby-living aging parents and grown-up children. They might also be interested in living in a community where they can walk or jog everyday of the week to keep themselves fit and healthy. Those living alone in single-detached houses might also be keenly interested in having their snow removed and/or their lawn cared-for for pay. Yet others might want to live in a community close to universities or colleges where their children can go for their higher education.

Baby-Bust women will be particularly interested in communities that offer good employment opportunities, children day-care centres, and primary and secondary education schools.  They might also be interested in living in a community that offers plenty of opportunities for fitness, social, civic and educational engagement.

Echo women will particularly be looking forward to live in “downtown like,” mixed-use residential neighbourhoods —rich in nightlife— in which they can have immediate access to parks and walking and jogging paths, fitness facilities, restaurants, bars, cafes and other places of entertainment where they can socialize with their peers on an ongoing basis. Schools and day care centres for their children, and employment opportunities for themselves will most likely be in their community priority list.

female viagra canada http://djpaulkom.tv/dating-at-40-57/ There are a lot of sites available that are painless and fast. With such medicines available online, one can really have the solution for this mind-boggling, confidence crushing problem which men are facing today. online pharmacies viagra You can treat the dysfunction either with the Kamagra tablet, and if you cannot swallow the tablet you order cialis canada can take your medication discreetly and quickly without anyone having to know. Showing that even though these drugs have been available in the generico viagra on line online market.

Women VS men —  impacts on housing across the generations

Women’s remarkable impacts on housing, as compared to men’s, are also being recorded in Canadian statistics. One important example can be seen as one compares levels of homeownership in year 2006 among primary household maintainers across six of the seven generations of Canadian men and women born over the past 100 years. Let us take a look.

 In 2006, there were nearly 4.7 million private households in Canada in which women were the primary household maintainers, and of these 59% owned their home. By comparison, in the same year, there were nearly 7.7 million private households in Canada in which men were the primary household maintainers, and of these 75% owned their home. By examining the individual homeownership trajectories of these two types of households by age-groups of the primary household maintainers (Chart 3), one can observe the following trends and based on them offer  two conclusions:


  Chart 3 — Source: Statistics Canada. Custom Tabulation from the 2006 Census, EO1706, August 11, 2011,Age Groups of Primary Household maintainer (13),Structural Type of Dwelling (10), Sex of Primary Household Maintainer (3) and Housing Tenure (4)for the Private Households of Canada, 2006,Census – 20% sample Data


 Trend one: —throughout all the age groups, the percentages of households in which men were the primary household maintainers were higher than the percentages of households in which women were the primary household maintainers.

Trend two: —the smallest gap between the percentage trajectory of the households in which men were the primary household maintainers and the trajectory of the households in which women were the primary household maintainers, was seven percentage points and occurred at ages 15- 24. By comparison, the largest gap was 19 percentage points and occurred at age 85+.

Trend three:  —the households in which women of the younger generations are the primary households maintainers had the best chances to reach homeownership parity with their men’s households counterparts. 

 Conclusion one: —as women continue to rise in society— it is very reasonable to think that an increasing number of households in which women are the primary household maintainers will lead their way towards reaching homeownership parity with their men households counterparts. It is also very reasonable to think that it will be the households in which women of the younger generations are the primary households maintainers who will have the earliest and best chances to reach that homeownership parity with their men households counterparts. 

 Conclusion two: an increasing number of homeowner households in which women are the primary household maintainers will mean growing demands for housing in the future.

 There is, however, a caveat which temporarily concerns the validity of the latter conclusion: will  households in which men are the primary household maintainers carry their current share of homeownership into the future, or will they progressively lose some of it as the homeownership share among their women’s households counterparts increases?                    

 The impact of women’s population size   

 The size of the women’s population is another factor that can impact on housing demand and community planning over the coming years. In 2006, there were nearly 11 million women between the ages of 15 and 64 years, representing roughly 50.5% of the total Canadian working-age population.[9]Over the next 25 years, the women’ population in this age group is expected to grow from nearly 11.9 million in 2011, to close to 12.8 million by 2031 and to just over 13.2 million by 2036, representing roughly 50% of Canada’s working-age population throughout these years.[10]

 Women as an emerging economy

 Over the past 100 years, women have become an increasingly important segment of the Canadian population. They have also become widely different from generation to generation in many respects, for example, in their education, in their social status, in their economic situation, and in their needs and wants for housing and communities. More particularly, over the past twenty years, Canadian women have made substantial gains in the labour force and although in general their average income remains lower than men’s average income, the income gap between men and women has been narrowing steadily over this period. As women continue to rise in society and through this path of success become progressively more important and influential in the economic market place, it may not be unreasonable to think of them as an emerging economy.

Next steps

It is very apparent that now is the time for community planners, designers, developers, and the housing industry in general to start tapping into the housing and community needs of women.

 Analyzing the population characteristics and the latest housing trends and needs and preferences for housing and communities across the various generations of women, and comparing them with those of their men counterparts can be highly relevant to the community planning and housing industries. This analysis can result in invaluable information for analysts to estimate housing need and demand; for planners to develop appropriate community plans; and for developers, builders and designers to develop, design and build the types of housing that women and their families need, want and can afford.

 It is also important to emphasize that examining ways for the planning and housing industries to respond to women’s housing and communities needs and wants, can, not only result in innovative community and housing solutions, but also in successful business for all involved.  

 Conclusion

 This article explored the rise of women’s role in society and the potential impacts on housing and communities. From the information presented, it is very clear that the profile of women in Canadian society continues to rise rapidly at all fronts.  

There is also much indication that women are already having significant impacts on the housing markets in all major cities across Canada. Women’s remarkable impacts on housing are also being recorded in Canadian statistics, and examples can be seen as one compares levels of homeownership among household primary maintainers across six of the seven generations of Canadian men and women born over the past 100 years.

 As the women of all these generations grow older, they will have increasingly important impacts on housing by prompting a steady and ongoing demand for a wide range of innovative housing choices that can meet their needs and preferences across generations. Nevertheless, the most significant impacts will be felt as the women of the younger generations continue to rise in society and through this successful path lead their way towards reaching homeownership parity with their men counterparts.  

 Also, as the women of all these generations grow older, they will have important impacts on communities by prompting the demand for communities that can meet their unique needs and preferences across generations. To this end, it will be necessary to examine the potential of “Smart Growth” strategies that can make communities more compact, with a good mix of land uses, and well-connected streets, sidewalks and pathways which allow easy walkability and access to support services and amenities. It will also be necessary to examine ways of creating more “Livable communities,” in which there is a choice of affordable housing and transportation, a sense of safety and security, a range of civic amenities and well-kept public places that provide opportunities for recreation, and social, cultural and civic engagement. And it will also be necessary to create more “Sustainable communities” that meet the needs of current and future generations while minimizing the impact on the environment.

 Clearly, the need and opportunities for the planning, developing, building and housing and service industries to explore and implement these ideas will exacerbate over the coming years.

 The next step, therefore, will be for local policy makers, planners, designers, developers, builders, financial institutions and others in the community and housing industries to find out, specifically at the local level, what kinds of housing and services women need; what types of living arrangements and lifestyles they want to pursue; and what sorts of communities they want to live in. Based on this information, they should be able to respond promptly by planning, developing, building and making available the types of housing choices and communities that women and their families need, want and can afford, now and in the future.

 ____________________________________________________________________

Note to readers:

This is an abbreviated version of the paper “The rise of women’s role in society: impacts on housing and communities.” To read the complete paper, click here – PDF

_____________________________________________________________________________


Luis Rodriguez is a housing and urban planning consultant, a Member of the Royal Architecture Institute of Canada and a former senior researcher with Policy and Research at Canada Mortgage and Housing Corporation (CMHC) in Ottawa. He had a highly distinguished career at CMHC, is highly recognized in Canada and abroad for his excellent work and unique expertise and innovation in seniors housing and community research, and has often spoken on Canada’s behalf at national and international housing events. He is currently examining Canada’s socio-demographic and economic trends and the potential implications for housing and communities. All illustrations in the article by, or adapted by, the author, ©2012.

 References

 This article contains text and statistical data that have been reproduced or adapted from official work published by the Government of Canada and the reproductions or adaptations have not been produced in affiliation with, or with the endorsement of the Government of Canada.


[1]Text adapted from: Thomas, Derrick. March 8, 2010. “The Census and the evolution of gender roles in early 20th century Canada” Article. Component of Statistics Canada. Statistics Canada Catalogue no. 11-008-X  Canadian Social Trends Number 90. Summary, page 45 and page 42,  second paragraph in the central column of text, and Chart 1 by Dominium Bureau of Statistics, censuses of population compiled by the Canadian Century Research Infrastructure Project. Retrieved on January 12, 2011. http://www.statcan.gc.ca/pub/11-008-x/2010001/article/11125-eng.pdf

[2] The term “household head” is now being replaced by the term “primary household maintainer.” Primary household maintainer refers to the first person in the household identified as the one who pays the rent or the mortgage, or the taxes, or the electricity bill, and so on, for the dwelling (there are no primary household maintainers under age 15). Source: Statistics Canada, 2006 Census of Population, Statistics Canada catalogue no. 97-554-XCB2006034 (Canada, Code01). Retrieved on January 12, 2011, from http://www.statcan.gc.ca

[3]Statistics Canada. Custom Tabulation from the 2006 Census, EO1706, August 2011. Age Groups of Primary Household Maintainer (13), Structural Type of Dwelling (10), Sex of Primary Household Maintainer (3) and Housing Tenure (4) for the Private Households of Canada, 2006 Census – 20% Sample Data.

[4]Adapted from: Marshall, Katherine. July 2011. Generational change in paid and unpaid work. July 12, 2011. A component of Statistics Canada Catalogue 11-008-X. Canadian Social Trends Number 92. Pages 13 (Introduction) and 22-23 (Summary). Retrieved on October 5, 2011, from: http://www.statcan.gc.ca/pub/11-008-x/2011002/article/11520-eng.pdf

[5]Royal LePage. 2007. “The 2007 Royal LePage Female Buyers Report,” pages 2, 3 and 10. Retrieved on April 1, 2011, from: http://docs.rlpnetwork.com/FemaleBuyersReport.pdf

[6] Source: Veterans Affairs Canada. The Second World War. History. Public Information Sheet. “Women at War.” Introduction. Retrieved on October 1, 2011, from: http://www.veterans.gc.ca/eng/history/secondwar/fact_sheets/women

[7]Thomas, Derrick. October 2005. “Socio-Demographic Factors in the Current Housing Market.”Feature article in Canadian Economic Observer. October 2005. Statistics Canada Catalogue no. 11-010-XIB. Page 3.2, first paragraph. Retrieved on October 9,2011, from: http://www.statcan.gc.ca/pub/11-010-x/11-010-x2005010-eng.pdf

[8]Source: Statistics Canada, 2006 Census: Changing patterns in Canadian homeownership and shelter cost. The Daily. Wednesday, June 4, 2008. retrieved on June 17, 2011, from: http://www.statcan.gc.ca/daily-quotidien/080604/dq080604a-eng.htm

[9]Source:Statistics Canada. 2006 Census. “Age (123) and Sex (3) for the Population of Canada, Provinces, Territories, Census Divisions and Census Subdivisions, 2006 Census – 100% Data.” A topic-based tabulation. Statistics Canada, 2006 Census of Population, Statistics Canada -Catalogue no. 97-551-XCB2006011 (Canada, Code01). Date modified: 2011-04-07. Retrieved on May 3, 2011, from: http://www.statcan.gc.ca/

[10]Source: Statistics Canada. 2010. “Population Projections for Canada, Provinces and Territories 2009 to 2036.” Table 11-1, Population by age group and sex, medium-growth – historical trends (1981 to 2008) scenario (M1), July 1st —Canada, 2010 to 2036. June 2010. Page 167. Statistics Canada Catalogue No. 91-520-X. Retrieved on February 17, 2011 from: http://www.statcan.gc.ca/pub/91-520-x/91-520-x2010001-eng.pdf