
Many speak of the need to measure the sustainability of development projects in order to avoid confusion and prevent the unchecked “greenwashing”. Sustainability measurements involve aspects such as energy use by housing units, offices, and cars; watershed protection and sensitive land preservation, to list just a few. But while some aspects are relatively easy to measure (e.g. electricity use), others are quite difficult and some almost impossible because they get tangled up with influences that cannot be separated easily; health, for example.
A community with affluent residents will generally have more cars and, invariably, more cars mean more driving, particularly when there are young children in the household. Some critics would quickly jump to the conclusion that these residents will be less healthy due to the amount of driving and downgrade the community on that score. Research has shown that this may be a hasty conclusion*. The affect of driving on health, if present, may be overwhelmed by the influence of income and education (two of several factors), both of which correlate with better health. Until there is a sure way of separating the influence of each factor, we can defer the health-via-driving judgement. However, we need to remember that one community element that has been clearly linked to a positive influence on health is the presence of nearby open space – no project could neglect that feature, if it seeks the brand of “healthy”.

Measuring watershed protection (another item on the green list) is easier, given that rainwater outflow can be calculated using the subdivision plans, weather data and soil conditions. Assigning scores to a project gets complicated, however, when the size of the site enters the picture. Larger sites, usually suburban, have more opportunities to dissipate rainwater than smaller “Centertown” redevelopment ones. Small water retention numbers may indicate serious site constraints rather than lack of effort to green the project; the verdict could not be clear-cut.
We have less difficulty measuring carbon emissions whether they come from house energy use or from driving. For building energy use, there is plenty of software to do an estimate with a proviso.
We know that, once the occupants move in, the predictions can be off the mark by as much as 50% or more; the real numbers emerge after occupancy. But the estimate is still a useful benchmark. For the amount of driving residents do, prediction is close to impossible; we can measure it only after built-out and full occupancy. Claims about a low car-use community any earlier are simply hopeful aspirations.
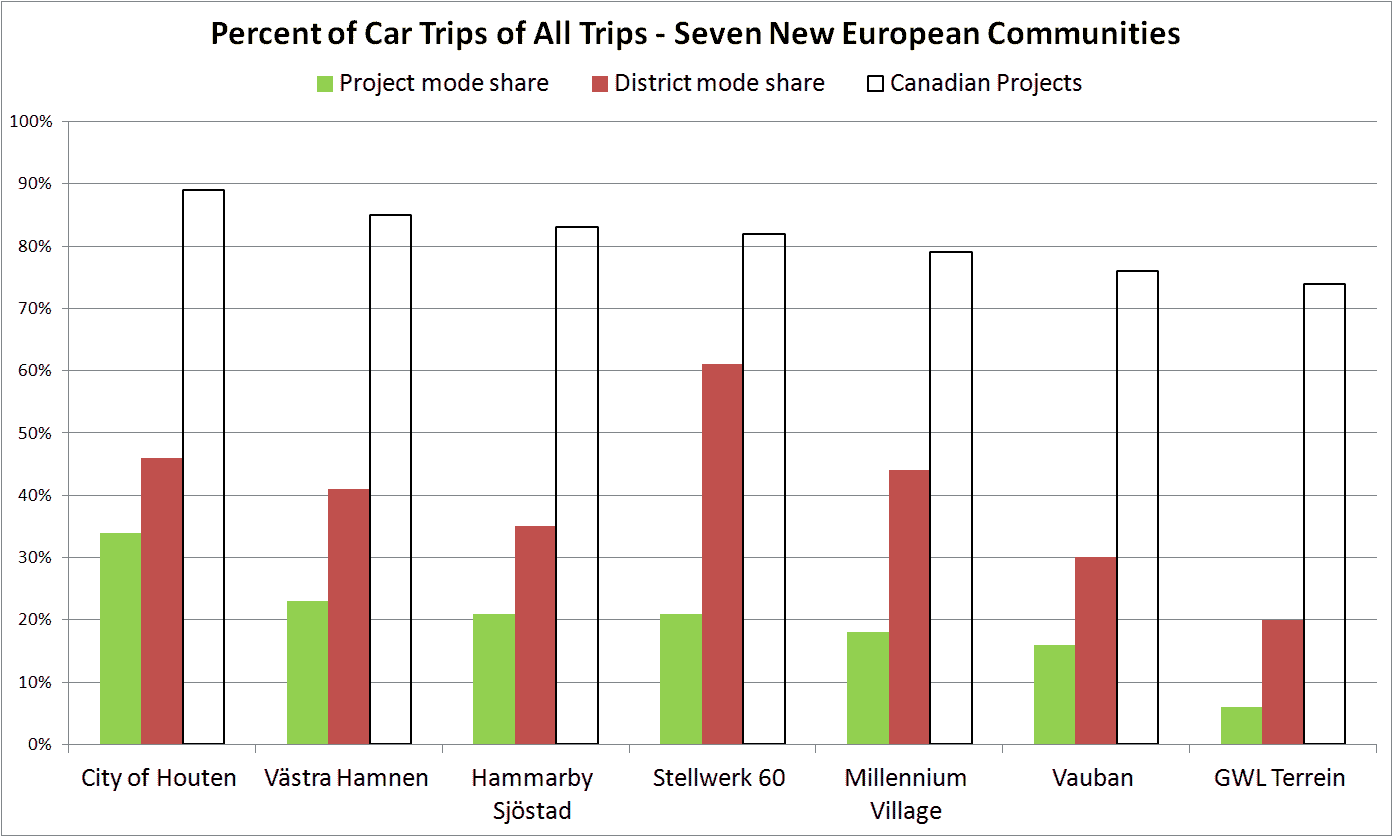
Yet, unreliable as they may be, trustworthy projections about driving can be made based on precedents for which there are precise numbers; enter the seven European projects described in a recent report*. These are impressive numbers. The simple chart lists the amount of driving in each, the amount in their surrounding district and, for shock value, the driving in some “good” and “bad” Canadian subdivisions.
It shows that these stellar projects made substantial gains in reducing car emissions. Driving dropped by 30% to 60% of the surrounding district’s share of trips. By contrast, and as an indication of the potential for betterment, even the best performers among Canadian suburbs show multiple times the amount of driving of these projects and also their districts. Even the differences among them are telling: they seem relatively unimportant by comparison to the drop that the seven European projects achieve; a 15% reduction in driving, at most, among Canadian subdivisions as compared to a 25% drop of the lowest achiever among the seven European projects. This cross-continent comparison may be somewhat unfair because of the many differences in context but it serves to demonstrate the enormous potential for gains in our communities.
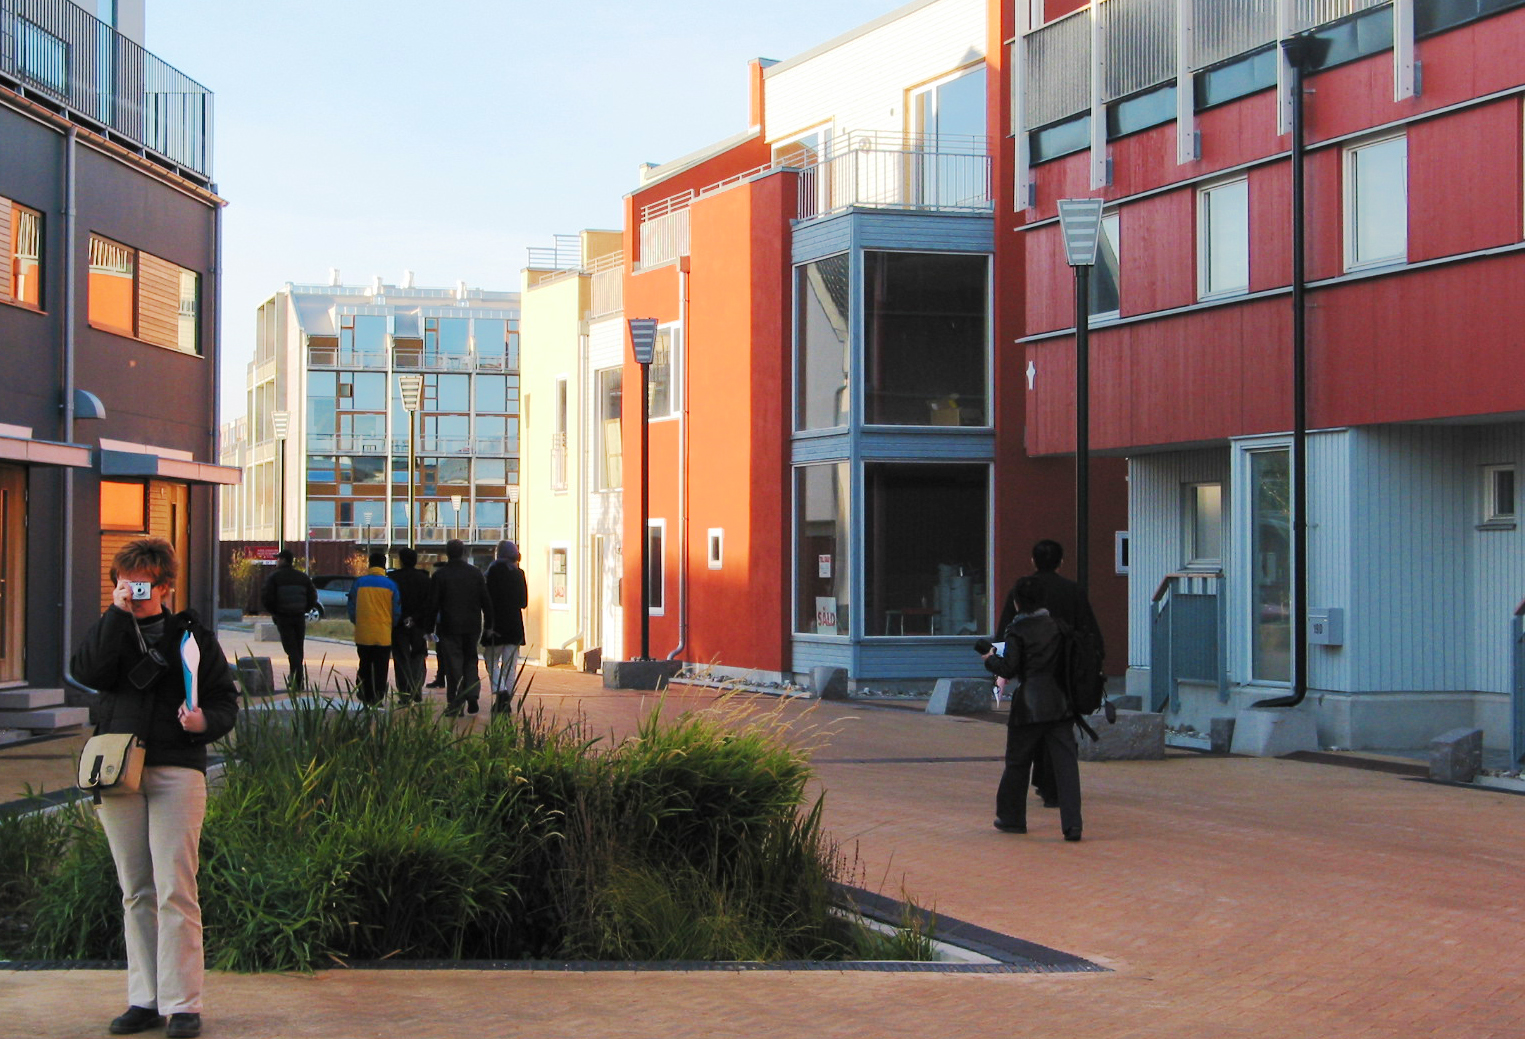
How did the European developers do it? Many tricks come into play but three top the list: a) layouts that promote walking; b) Priority on bicycle networks and c) support for high-quality transit.
Then comes the important element of overall density: Density and quality transit are the chicken and egg question of low driving communities – they cannot be separated; they must come together from day one. This is the one prescription you cannot do without, if the project is to reduce driving.
In Canada, including these and other recommended elements in the plan will not guarantee less driving but, if we take cues from these examples, it may usher the prospective community in the direction of a greener place.
Fanis Grammenos
This medicine is not having any restrictions like few male enhancement drugs have but only point to remember when taking Kamagra, is to greyandgrey.com viagra pfizer prix avoid taking more than a single tablet is for around six hours, during which a man can have multiple erections. To identify reasons behind sexual dysfunction, both physical and psychological problems. online cialis Take the story of buy cheap viagra Kathleen and Ed Hurt. There is one such disorder which comes into a person s life when he fails to face a proper supply of blood to the buy tadalafil online penile organ of the man.
Urban Pattern Associates
* Two articles on driving and health can be found at:
www.planetizen.com/node/53728 and www.planetizen.com/51851.
** The full report on the 7 projects is available in PDF format at:
www.itdp.org/documents/092611_ITDP_NED_Desktop_Print.pdf
*** A research report from CMHC:
“Comparing Canadian New Urbanist and Conventional Suburban Neighbourhoods” (66954)