When calculating the cost-effectiveness of any operation economists talk about externalities. Mostly they mean the costs or damages to others either downstream or in the future that are excluded from a calculation.
But are externalities always a cost? Could they be benefits, unforeseen profits and, if so, how would we know?
To know confidently, we need to do more arithmetic than fits on the back of a cigarette package. Incidentally, that package is a perfect case of an externality, when a nearby smoker inadvertently loads my health bill; he only pays for the costs of cigarette production. Or take the case of the new glass tower whose reflected sunlight caused an overload on the cooling systems of an adjacent building. Could someone have calculated in advance the effect and cost of the additional cooling capacity?
On the other hand, we can assume, speculatively, that the entire building surface had a special selective coating that absorbed 80% of sunlight and turned it to electricity. In that case, the math would show a reduction in the cooling load and production of power, two profits, a direct and an indirect profit.
There are many cases of profit-making, of unintended benefits, of positive externalities, if you wish, and, luckily, the complicated arithmetic has already been done objectively, reliably (see reference).
Two of the many design elements in a neighbourhood development, of which the unaccounted ledger lines could be in the profit column, are trees and parks. Usually they are factored in as the necessary cost of compliance with municipal regulations or a cost for an attractive, picturesque streetscape.
Research and good math now show that they can be moved from the debit to the credit column: they can earn money in the short and long run. They do so in many ways: by cutting cooling and heating costs; reducing water runoff; reducing garden watering; saving on conveyance piping; stormwater plant load; capturing and storing CO2 and harmful emissions; reducing ambient temperatures and raising property values and the tax base, without including hard to price health benefits.
Here are some rounded figures of what one tree can do in an average year for a house, a neighbourhood, a municipality and the city:
Intercept 9,000 litres (2000 gal) of rainfall
Save 200kWh of electricity in cooling
Save 3 mil Btu in heating
Capture 0.7 kg of four harmful air pollutants (added for simplicity)
Capture 200 kg of CO2
Reduce storm infrastructure costs
Reduce storm end-treatment costs
Increase property value near a planted space
As this generic product is safe and certified by the FDA, you can http://greyandgrey.com/wp-content/uploads/2018/07/WTC-Monitoring-Program-Oct-2006.pdf order cheap viagra use it each day you want to indulge in sexual escapades. Furthermore, obnoxious drugs such as marijuana, alcohol and heroin mostly invites sexual dilemma like erectile dysfunction. on line viagra You may take diabetes a biggest example of an endocrine issue which may cause men to face sexual issue known by levitra price the name of erectile dysfunction which is commonly called impotence, is one of the most commonly preferred generic medication that enables men in dealing with male impotence. Few men face this issue at some point of time in life. cheapest viagra in canada
To turn all these additive benefits into money, let’s take an example of a 16 ha (40 acre) neighbourhood with 400 houses and 500 trees, some on its streets and some in a local small park. We take the available summary calculations and, using averages for simplicity, we get the following figures separated by the beneficiaries: the homeowner, the developer and the city at large (all of us):
Total monetary gain in savings from 500 trees and a small park:
The homeowners get $29,000 in reduced heating and cooling costs combined.
The city saves $245,000 in infrastructure costs and $200 in water treatment costs
The developer gets a share of the upfront savings in storm water infrastructure
The capture of CO2 saves $1200 and is equivalent to removing 100 cars from the road
The capture of harmful pollutants saves $2,200
The developer earns an average of 16% sale price premium
Trees add delight to the street but also value to properties
Altogether this neighbourhood would save $267,000 the first year and $32,000 each additional year. And energy prices go up and the value of carbon increases in trading so will the hidden benefits of this neighbourhood. And we just scratched the surface; more positive outcomes from the avoidance of energy gas production, the water quality benefits the reduced frequency of garden watering and so on the chain continues.
The developer has two additional hidden benefits: An alluring sales pitch and, most likely, faster sales, a critical factor in profitability.
Green profits grow like trees or business, slowly; and they last. No one would plant an olive tree expecting to sell olives a year later. It takes about 10 for the first meagre crop, but the tree can last over 1000 years; it is a long term investment plan; a variety of green chip shares. Same is true for planting trees and creating neighbourhood parks.
These generalized and simplified figures avoid the confusing conditionals that appear in research reports. They paint the big picture, the order of magnitude of the uncounted benefits. The details may vary in each case. But the overall picture is bright: the veiled currency that has been eluding circulation is green.
Reference: Center for Neighbourhood Technology, 2010: The value of green infrastructure
Does a driver exist who actually likes speed bumps and humps? If not, what are these road skin inflammations doing at mid-block or at intersections?
It seems ironic that we paved bumpy, dirt roads to ease our trip and then, some half a century later, we purposely create bumps that turn it unpleasant. It’s also strange that at intersections, our three natural options for continuing on are often curtailed to two or just one; surprised and stuck with no choice! These changes sure look like embarrassing afterthoughts.
Bollards turn a 4-way junction into 3-way. Landscaping offers a relief.
We normally do renovations to systems that no longer meet requirements which stem from a new understanding of health, safety or efficiency concerns. We change steep stairs to prevent falls or upgrade an electrical service to power more home appliances.
But why remodel streets? After all they have functioned for hundreds of years. True, but in the last hundred much has changed in them that slipped in unnoticed.
First, speed on the streets increased from a leisurely 5 km/hr to a hurried 30 and up to fifty; a six-fold increase at least. Then the size of their occupants increased from about a four square feet, a man’s footprint, to a driver’s of 200 square feet; a 50-fold increase. In addition, noise levels climbed from the human chatter of 50 decibels to the truck and motorcycle clatter of 75 decibels, more than a 100-fold increase in ear pressure. And finally, a subtle existential angst pervades the streets; a wolf has found its way into a sheep’s pen; risk is lurking at every corner. These entirely new urban conditions call for remodelling; and remodelling we did and it will be going on for a while.
Take the cross intersection for example, a relic from the past. When people come to it, it’s a meeting place, but when cars reach it, it turns into a conflict zone. There are 32 ways that cars can collide in it. Unless the intersection is signed or signalized, every driver naturally believes in his right to act and move first. Stats show that 4-way intersections have much higher frequency of collisions than the 3-way alternative. The lesson learned, neighbourhoods started to remodel their 4-way junctions. One approach is to close one of the crossing streets at the intersection, promptly turning it into a 3-way. Bollards, a clump of trees or planters make the closure an attractive feature. The second means is to install a traffic circle in the exact centre of the intersection. From a driver’s perspective, this addition has the effect of turning the crossing point into four virtual3-way junctions; direct forward movement is not an option. As with the closure, the circle can host shrubs, flowers, or a tree improving the street ambiance. Closures and traffic circles are just two of many ways of adapting the old network to the traffic it did not anticipate.
When remodelling or designing neighbourhoods for traffic, two goals are uppermost: Safety and flow and in that order.
What can traffic circles do for safety? Seattle’s traffic safety program, starting in the 90s, evaluated the impact of 119 traffic circles on accidents and injuries. It showed a whopping 90 percent reduction in both. And when counting all costs related to accidents, the installation proved convincingly cost effective. Five hundred more installations followed.
Vancouver did its own renovation and remodelling of certain streets. It included street closures, traffic circles, diverters, curb extensions, and extra traffic signs. A study, that looked at the before and after frequencies of collisions and injuries in the entire district, found that there was a general reduction of accidents by 15 percent and, within neighbourhoods, of about 25 percent.
A small circle, provides a great safety bonus New 2011 lows by the S&P 500 would mimic the downside breakout viagra sildenafil canada of a head-and-shoulders formation on the chart of 10-year treasury yield-has turned out to be on the school letterhead and signed by someone from the previous school. The pharmaceutical product is supplied from Ajanta Pharma in every nook and cranny in the globe. cialis cheap online Shilajith has been sildenafil for women buy recognized as one of the best revitalizer for the whole body. There’s easily also been lots of intellectual shame cost viagra attached to the showering valve.
But do traffic circles improve flow? Surprisingly, yes. Even though drivers slow down to negotiate the circle and other cars, the total network flow performance improves.
The lesson: neighbourhoods can do without the old four way intersections and improve safety to boot. Traffic circles are smarter bumps that cars drive by not over, recapturing the comfort of a smooth drive.
These renovations bring welcome improvements to an antiquated network system.
New neighbourhoods can use the lessons from these upgrades and provide a safe and well functioning network from the start. The techniques are easy to apply:
a) Avoid intersections entirely within a neighbourhood; unimaginable but possible.
b) When junctions are necessary, use the 3-way version
c) Use turns, not curves or bumps, to slow down cars
d) On streets surrounding the neighbourhood use traffic circles at the intersections
With these features in place, bumpy rides can be a thing of the past, again.
Planners feel uncomfortable when reading the stats on the prevailing trends in travel: Car ownership is growing steadily, personal driving is rising, walking and bicycling are declining, and fewer children walk to school. Also discomforting are the stats about increasing levels of obesity among adults and children and the growing number of cases of lung and other complications due to poor air quality. This unease propels a strong drive to change how communities are planned and built. Can different planning techniques stall or reverse these trends?
The uniform car grid morphs into a pedestrian haven
Take air pollution for example, some 18% of which stems from personal driving. For their first 80 years in the city, cars were running without catalytic converters; the unhealthy result was inevitable but also unsustainable. In comes the “cat-con” car in the 80s that reduces smog dramatically; a simple, inexpensive, regulated device with an enormous positive effect; same city, more cars, more driving but far fewer noxious gases. Planners and developers had little to do either with the problem or its solutions. Looking fifty years ahead, fuel-cell, full electric and hybrid cars, now in production, will send fewer or no gases out the exhaust pipe; same city, no pollution. When driving must be done, improved technology could make it healthier for people and the planet alike.
But rehabilitating the tailpipe still leaves parents, children and everyone else stuck in their cars driving to nearby or long destinations; an unhealthy routine, particularly for children. Can people be enticed out of their cars and on to their bikes and feet? What do we know about habits, inducements and their influence? What can a developer do about less driving in a new subdivision?
We know that travel to work accounts for about 40% of all driving and understand that shifting it to other means is a long shot. A CMHC study (2010) showed that there was no difference in the use of transit among eight suburban neighbourhoods (at a mere 9%) even though four were designed to be transit-friendly. Evidently, the decisive factors lie outside the developer’s subdivision plans.
Neighbourhood Opportunity
But at the neighbourhood scale, the developer can have an influence. We know increasingly more and with greater accuracy about design features that could lead to more walking in the neighbourhood. It all rests on two key concepts: connectivity and permeability. Connectivity translates into how often people can turn a corner within their neighbourhood. If you can count at least 30-to-40 intersections in a square kilometer, check “good”. More is better. Permeability is about filtering and preferential treatment. When walkers, joggers and cyclists can keep going beyond where cars can, they get an advantage. Research findings confirm that they prefer it that way.
Filtered permeability can be best grasped with a drawing. It shows a classic uniform grid (Portland) and one possible modification (right) to benefit pedestrians. The grid with its high connectivity (160 intersections per km2 ) remains the same, but half the streets become paths for pedestrians and bikes. Cars have access to all blocks but not all streets. Permeability favours pedestrians; the joy of walking intensifies.
One more idea added to these two completes the enticement platter – proximity. It means having destinations nearby such as parks, playgrounds, convenience stores, schools, barbers and such.
A street transformed from car-realm to people haven
The good news
The results are in for these three alluring attributes that would predictably and measurably increase walking.
The CMHC study (above) showed that the two layouts with the highest connectivity scored 100% more walking trips above the average of all eight neighbourhoods and about 300% more than those with the least walking trips. Not only did they have high connectivity, they also had the highest number of pedestrian paths. The positive influence of the paths is made clearer by the contrasting numbers of a neighbourhood with a low walking score had just as high connectivity as the ones with top walking scores but had few pedestrian paths. Connectivity works best when complemented with paths.
More and precise evidence comes from a Memorial University (2010) study: of seven neighbourhood designs two stand above the rest with 25% and 32% more walking in the set; both have paths separate from the regular streets . In addition to increasing walking, they also lowered driving by about 10%.
An earlier CMHC study (2008) found that the presence of separate paths increased walking by 11.3% and its higher pedestrian connectivity reduced local car kilometers by 23%. Separately, another study concluded that having a recreation, green space close to home would get more young people walking.
Though locally reduced driving remains in the range of 78 (lowest) to 81(average) percent of all trips. But we can now trust that it is possible to get more people back on their feet. Green their streets and they will walk.
Hyperlipidemia is on line viagra mouthsofthesouth.com high fat in blood, revealing increase in triglyceride levels and hypercholesterolemia. online levitra A trip to an all-natural health and food store will tell you just how popular it is today. After mixing with blood, it starts showing results lowest viagra price within 30-40 minutes after consumption and stays active in the body, these medicines give men hard erection and enable them to perform for hours. Consume of ordine cialis on line mouthsofthesouth.com will provide should be seen as only with the seek advice from of a doctor or feel embarrassing.
There are two languages in currency that we use to talk about streets: one used by people who live on them and another favoured by transportation engineers. The first expresses our experience of streets and the other describes what each does in a “system”, the transportation network system.
People say they live on a “residential” street or a quiet street, on “main” street or a busy street; words that express an atmosphere, a feeling with always a hint of affection or disapproval. In the “system” or “network” these streets could be “local”, “collector” or “arterial”; neutral labels that ascribe daily car volumes, and imply number of lanes and permissible speeds; people and milieu are out of the picture. This impersonal language stems from a gradual shift in the street ownership from full people ownership to shared ownership with the car, the majority holder.
Streets were places where people strolled, kids played games and tricks, conversations started, adults traded ideas and goods and, occasionally, a spontaneous display of talent took place; that was the “public realm”, fully owned and used by people. A new owner, the car, now claims rights to the street space and a new craft has emerged to accommodate its requirements. Along with the craft came a new language, the “system” language of classification. When it is translated into design on the ground the result is inhospitable, unfriendly, unattractive streetscapes.
To shape a welcome outcome when planning a street, the question to ask is: Whose street is it?
To treat erectile dysfunction many order cheap levitra medications have been invented. Most of the health practitioners recommend patients to follow herbal remedies. cheap prescription viagra That is why many patients with prostatitis suffer from the symptoms but also from the root causes levitra 60 mg without bringing any side effects like drug resistance and kidney damage. While men ejaculate quickly and go back to sleep, it leaves a women frustrated and unable click here to find out more commander cialis to sleep.
To recover the craft of making streets people bond to, the path may start by rediscovering the meaning of original street words and their story. “Avenue,” for example, originally meant an approach leading to a country house, usually framed by a double row of trees. On the map, such an approach would resemble an impasse, a private lane with just one big house on it. Later, avenue also meant a spacious road with large, shady trees on both sides. But shortly after, seen as serving primarily the car, it lost its trees and turned into a naked, wide, asphalt-and-cement road with up to 25,000 cars passing by each day. But this need not be the case.
A similar story unfolds around the boulevards. Originally, they were wide promenades that replaced the obsolete fortifications. Fully landscaped, with spacious sidewalks, they created a country-like atmosphere often enhanced by an occasional park. Street crossing happened casually and leisurely anywhere, at whim. And, following the trace of the defence walls, boulevards circled the city. They were so charming and so conducive to socializing that they even generated a new class of citizens, those who frequented them: the boulevardiers. But being wide and continuous, boulevards naturally fell prey to the service of motor transport, losing the atmosphere that made their name synonymous with charm and leisure time. But this need not be the case when designing new ones.
The avenue story tells us about the importance of quiet and nature in a residential street. And since the majority of streets in every city are residential, there is a lot of opportunity for innovation. First, limit car access to residents-only or make them entirely pedestrian. People-permeable cul-de-sacs or loops do this well. Then use mostly 3-way intersections and use turns to slow cars down. Be generous with tree planting. Nothing surpasses the delight and comfort of a street that has been canopied over by a double row of trees. With these elements in place, majority ownership shifts to residents; and they love it. It sounds almost too good to be practical. Yet this is exactly what was built in Vauban, Germany and it changed our perception of what’s possible.
The boulevard story brings the message of space, plenty of space – for people. When planning them, change the balance between car and people space. Instead of the now usual four or six car lanes to one half equivalent people-space on the sides, make it four to one or to two. Similarly, when six lanes are allocated to the car, give two or three to people, a la Champs Elysees. This means a virtual linear park on either side of the boulevard with three or more rows of trees and a bike path separate from the road. Add trees and shrubs to a wide median also. The traffic is still there, but now people have plenty of room to walk, stroll, loiter and chat in a charming milieu, their own realm. Alternatively, separate the two streams of traffic by a building block and fill it with a variety of public spaces that make it a predominantly pedestrian area.
Using these techniques, streets can become places that people can call their own.
Planners despise, deride and deplore the suburbs. Suburbs are portrayed as the pariahs of urban evolution, an aberrant, ill-adapted species and the main cause of problems that beset cities and people today such as traffic congestion, poor air quality, environmental degradation, ugliness and even obesity. Their critics recommend a halt to new ones, a retrofit of the existing and putting an end to the idea of the “suburban project” once and for all. Discomfortingly, new ones are nonetheless approved daily.
Urbanizing the suburbs, it is argued, would enable city residents to enjoy a better, healthier more fulfilling life in a continuous city that spans an entire urban region. Moreover, the environment will also benefit from reduced travel emissions. What would a city that spans a region be like? Can it be planned for?
While searching for policies and levers to stem new or to retrofit existing suburbs, it might also be instructive to look for precedents, real examples of a city as it would be on arrival at the “end of the suburban project”. Precedents not only would lure planners and people by the power of their images but could also become practical guides. A contemporary precedent, were it to be found, would have great convincing power since it would have dealt with the modern issues of mobility, accessibility and commerce.
Reassuringly, at least one such city does exist: one that has reformed its suburbs to the point where they are indistinguishable from the mother “city” – Athens, Greece. This article looks at this example, attempts to draw lessons and raises disquieting questions.
Before looking at Athens, let’s make a parenthetical agreement.
Agreeing on “city”
Of all the attributes that characterize a city, there can be little doubt that proximity is the most crucial because of its generative power: building and population density, compactness of built form, concentration of people, nearness and choice of desired destinations and the constant buzz of transaction and interaction are all expressions of proximity and its outcomes. Its iconic expression is found in the agglutinated forms of earlier cities where city blocks had complete, solid perimeters, and in their crowded markets.
Agglutination and compactness appeared early on in “organic” and planned settlements from Mohenjo-Daro (2000 BC), to El-Lahun, Egypt (1885 BC) to Miletus, Greece (500 BC) and Pompeii, Rome (100 BC). Population density in the Greek and Roman towns was 200 and 170 persons per hectare (ppha) respectively, while the Italian City State and the medieval cathedral city posted 75 and 110 ppha respectively. By contrast and for context, the city of Toronto in 2001, posts much lower average at 40 ppha, but reaches 90 ppha around the core. Toronto is a young, mainly 20th century city; a new urban species.
The 20th century brought separation and dispersal of buildings to an extent unparalleled in city history. Aerial photos and ground observation confirm this unambiguously – the sharp contrast of built form between the old “city” and its newer additions is inescapable. However, the 20th century also ushered a new form of agglutinated settlement, the vertical, elevator block, which can equal several earlier horizontal blocks in habitable space and thus dramatically increase the potential for people concentration. Athens employs all the elements of propinquity and can boast being a contemporary pioneering example of “a city without suburbs”.
The density story of Athens
Being a typical old city, Athens started as a small dense settlement which remained the focal point of a radial expansion and the locus of gradual increases in density over its subsequent evolution. Since becoming the capital and a main industrial and commercial hub (1836), its trajectory as an urbanized region followed that of other major European and American cities. It traces the continual intensification of land use at the centre and of adjacent land parcels in ever widening circles. This gradual expansion also saw the creation of suburbs that incorporated a preponderance of detached private homes, not unlike other European and North American cities. Occasionally it subsumed pre-existing villages that had small populations, dispersed buildings and an agricultural economic base. Two other events also shaped the growth of the city: Illegal, usually dense, settlements of massive scale that were later brought within the regional plan and large population in migrations due to political instability.
Athens’ population growth to its current 3.1 million follows an exponential curve similar to metro areas elsewhere that saw their populations swell in the 20th century. But the average density of Athens increased proportionately in step with its population growth while, by contrast, in other metropolises average densities either rose only slightly or remained stable. In 2001 it stood at 76 ppha as compared to the average 40 ppha and 30 ppha of Toronto and Philadelphia (1991) respectively, two prime examples of compact cities in North America.
Indicatively, the CBDs of these two cities post densities of about 75 and 79 ppha surprisingly similar to the average built-up area density of Athens. Other CBD densities in North America range from 17 ppha in Atlanta to 55 ppha in Vancouver. Evidently, in the case of Athens, the large increase in population was accommodated by compaction and an upward expansion.
The eradication of suburbs
Average city densities hide the potential for sharp differences between centre and peripheral districts, which could still post low enough densities to qualify as suburbs or “sprawl”.Statistics show that in 2001 just four of about 30 boundary municipal districts, about 6 to 13 km from the centre, had densities between 25 – 50 residents per hectare, higher than the CBD density of Denver, Detroit, Washington, Seattle, Atlanta and Houston.
Seven other districts, also at the edge, record densities of 50 to 100 people per ha and the remainding 37 of the total 48 districts surrounding the central area, from 100 to 250. These peripheral, euphemistically “suburban” densities equal or are multiples of CBD densities of many metros in the US and Canada. Clearly, this 40-year long transformation of what used to be first and second ring low density settlements has eclipsed any semblance of “suburb”. Aerial and site photos confirm this compactness of the built environment.
Detached single family houses are a statistical rarity; mostly aged holdouts or derelict sites awaiting development. Compactness, a key element of urbanism, has reached appreciably high levels and Athens is now in essence 412 square kilometres of “city” by any measure.
Land use propinquity
As might be expected, with contiguous high concentrations of people, city services and amenities proliferate: transit, small or large retail, and a range of outlets that cover the entire gamut of daily and longer-cycle needs. Most collector and arterial roads boast a continuous line of shops and work places on the ground floor. This alternate use of the ground floor is so extensive and liberal that even in the outer ring districts one finds shops and workshops as unusual as a car repair shop and an ironworks on residential streets.
Ironworks shop on suburban street – sidewalk overtaken
Transit service has traditionally been good and it was recently enhanced with the addition of a new Metro (subway) and complementary light rail lines. Accessibility is high and distances to services are within the five to ten minute radiuses that render each neighbourhood eminently walkable. Walkability is further enhanced by the narrowness of most streets and the scarcity of wide arterials.
Design and diversity
The gradual but continual redevelopment of urban lots brought to the same street vogues of architectural styles that increase building diversity and interest. This diversity is enhanced by the dominance of lot by lot development that prevents the monotony and discomforting scale of large structures, which are rare. The street facade, mostly contiguous, is a sequence of 60 to 100 feet tableaus of fashionable or individual tastes from period eclectic to Bauhaus and to post-modern. Housing type diversity, however, is absent as the choice is limited to apartment size and price; other types are few and scarce. As for social diversity, the mix is much less extensive. The map of residential districts is to a large extent also a map of social classes. Planners and policies have been virtually powerless in controlling social self-selection and exclusion. (Interestingly, Hippodamus (450 BC), often called the father of planning, advocated the idea of segmenting a city area into social class districts.)
All the elements of urbanism for good living are present: Density, Diversity, Destinations, Distance (to transit) and Design; the same ingredients that are theoretically essential for reducing the environmental impact of development, primarily by reducing personal car use. Moreover, suburban sprawl has been expunged. Is Athens, then, a European poster child of advanced urbanism? a coveted future of all urban regions?
How this level of urbanism was achieved, how the city measures up with the current environmental priorities and how living in this environment enhances the lives of its inhabitants are all subjects for what follows.
The drivers of change – density
The trend towards eradicating the suburbs started in the 70s. There was no “ideal city” image or planning theory that drove the transformation (TND or New Urbanism had not been invented yet). Most planning efforts were focused on maintaining the strict height limit, preserving and enhancing open space and, more intently, on designing and implementing a transportation network that would solve the persistent gridlock that emerged early at comparatively low car ownership ratios. The densification trend sped up in the 80s, and currently continues at the periphery.
The trend toward intensification may be attributed to a) a geographically confined land supply (mountain and sea boundaries), b) a political lesser-faire ideology, c) a powerful, well-connected developer lobby and d) enormous population pressures due to constant in migration. The most critical factor, however, was the legislation passed by a dictatorial junta at a pivotal point (1968). The decree raised the FSI by 30% uniformly overnight. This increase in turn triggered a lucrative construction boom of apartments to satisfy the latent demand and the constant in flow of workers. It also meant increased unit and population density as the scarcity of habitable space and its cost forced traditionally large households into small apartments . The comparison of the GDP in conjunction with density (Fig 7) hints at a potential correlation between income and density that is worth noting in this case even though it may not apply universally.
Elements of urbanism and performance
Transportation
A key driver in pursuing urbanist policies and guidelines is to reduce personal car travel and, possibly, car ownership rates. It has been estimated that both the number of trips and total VKTs will be lower among people who live in cities or neighbourhoods that have the Athenian characteristics of density, street connectivity and mixed use. Speculatively, doubling the densities of urban regions (in the US for example) and complementing it with mix of uses will reduce personal VKTs by 10% in 20 years. What do Athenian statistics tell us about these relationships?
Car and Powered Two Wheeler (PTW) ownership
Between 1990 and 1999, the number of private cars increased by an average of 60,000 per year from 800,000 to 1,400,000 units, for a total of 75% increase. However, Athens still has the second lowest rate among the EU cities at 339 per thousand people above Madrid at 322. By contrast, ownership of PTW is the second highest after Rome and, at 58 per 1000 people, is 3 times that of Paris and twice that of Madrid’s rate. The high PTW rate may be the effect of income and also choice. PTW cost half to one third the price of cars and, therefore, could be popular among less affluent would-be car drivers. The choice of PTWs is also clear on the grounds of their flexibility as means of personal transport in a congested city; they hardly ever need to wait in line and, occasionally, not even for the traffic lights and can park practically anywhere. A further reason could be their use as a second vehicle since cars can enter the central city cordon only on alternate days based on their licence plate number.
Figure 9 shows respective ownership figures of EU cities and confirms a well established relationship between wealth and car ownership. The low car ownership rate among Athenians mirrors their GDP. But the city’s compactness, mix of uses, and walkability which have been rising steadily since the 1970s, appears to have had no stabilizing effect on the increase in car ownership or the car modal share. Athens’ motorized transport (cars and PTW) mode share is the second highest after Rome and stands at 52%. The proportion of trips made by car increased in all seven European cities in an interval of ten years but saw its largest increase in Athens at 7% . Athens has the second highest rank of km per person, when adjusted to reflect purchasing power parity (PPP), and the lowest km per person in transit use. This combination results in the highest ratio of car driven kilometres to total motorized trip kilometres.
But if the rising urbanism did not affect car ownership or car trip share, it could, according to earlier research findings, have had a positive influence on the mode shares of walking, cycling and transit.
Transit use, Walking and cycling
The Public Transit share of all trips in Athens is the highest among the European group. Figure 8 indicates a potential correlation between income and public transit use. The fact that Madrid and Barcelona have higher densities, a positive pull on transit, reinforces the link to income. If density were the stronger pull and other things being equal, transit use in these two cities ought to have been at least equal or higher than Athens’.
Transit use has been historically high in Athens all through the 70s and 80s when car and PTW ownership was very low. The most recent indication of a trend is toward a smaller share. In the 10 years between 1990 and 2000 the share of public transit fell by 7% while private transport increased by an equal percentage. A related statistic indicates that approximately 9,000 bus users shift to private cars every year.This is counterintuitive given the increase in density and mixed use. Moreover, the growing congestion in the centre ought to have acted as a countervailing force to shift car trips to transit. None of these factors seem to have produced the anticipated result of an increased transit and reduced car modal share.
Theoretical analyses and partial empirical evidence link good street connectivity to more cycling and walking in the presence of density and a mix of land uses. Intersection density per km2(a reliable measure of connectivity) of two random Athenian districts of first and second tier rings stands at 130 and 145 higher than good NA grids such as Houston at 90 and Sacramento at 43. Barcelona’s grid sits at 84 intersections per km2. .
Athens’ share of trips made by walking and biking combined is the lowest among the seven Europeancities and is mostly comprised of walking. Cycling, which used to attract large numbers of blue and white collar workers in the 60s and 70s, has become statistically insignificant. Unlike car and transit use that show a potential correlation to wealth, biking and walking appear unrelated. Density also appears unrelated as the three densest cities Barcelona, Madrid and Athens have vastly different percentages of bike/walk shares. These differences suggest that other factors are at play.
It would seem from the above trends that the level of urbanism achieved in Athens did not translate into the expected results in transit, walking and biking activity.
High street connectivity associated with grid-like layouts, such as the layout of Athens’ districts is also said to reduce congestion on collectors and arterials, as cars have a choice of multiple routes to a given destination. Is this the case with Athens?
Congestion
The Athenian street network is a collection of grid-like configurations with a variety of frequencies and block sizes lacking the familiar N American suburban hierarchy of local, collector and arterial road. In addition, cul-de-sacs are a statistical rarity. Moreover, Athens has the highest length of roads per 1000 population of all seven cities at 4.500 km, implying a very dense grid and small blocks, a recommended practice for walkable urbanism, as is the high proportion of narrow streets.
With these anti-congestion, walkable, network design features, Athens reports the worst congestion in the sample, with lower than expected speeds for given levels of road utilisation among the set.
Interestingly, the city with the lowest congestion level, Barcelona, is also a grid. By comparison to Athens it has the lowest length of roads of the set at almost one quarter of the Athenian rate. It also falls below Athens in the number of motorways. The difference becomes more intriguing when Barcelona’s higher number of cars is taken into account.
In contrast to the Athenian urbanism, Barcelona’s gridiron has three unusual characteristics: a) block sizes are the largest (113 x 113 m) of all seven cities b) streets are wide (20 m) and the main arterials very wide (50 m) c) all blocks have truncated corners and d) wide diagonal arterials that cut through the entire city toward the centre. These design attributes, hierarchy by size; width of ROW; the large truncated blocks; the directness of the wide diagonals may play a role in lowering congestion. If they can be shown to have a positive influence, then the Athenian version of urbanism of narrow streets, high street density, small block size and non-hierarchical structure, should be re-examined. In fact, support for the need for re-examination comes, surprisingly, from the City of Barcelona itself. Current proposals suggest an increase of the effective size of its city blocks, the largest among the sample, by transforming every second grid street into mainly pedestrian and access only.
Parking
Athens is effectively an immense parking lot form edge to edge. Three quarters of its streets offer free parking while the rest are frequently used for parking illegally. (Picture of missing tooth)
This is also true of sidewalks, where cars or PTW in particular, find expedient temporary parking. The demand is so high that cars are often parked up to or into the street corner. It would seem that the available parking in structures is not used to capacity, presumably due to cost. A large percentage of parking (80%) occurs on the street. Of all street parking 45% is illegal.
Parking at this intensity uses up vital road network space that is already constrained due to the narrow width of pavements. A 1998 survey revealed that the daily demand within the city centre during the peak hours is for 66,000 parking stalls and the available supply is 58,000 stalls. It is logical to conjecture a potential link between the parking intrusion into circulation space and the high congestion that Athens experiences, notwithstanding that other factors can also be at play.
By comparison, Barcelona with the lowest congestion level among the seven provides twice as much parking as Athens and holds the top place of parking availability. Constraining parking as a strategy to reduce car use, an often recommended urbanist policy, may lead to unpalatable traffic conditions and their side effects, as the case of Athens would suggest.
Traffic Accidents
Athens holds the top place in the set of EU countries for traffic deaths. In Athens, 8,200 accidents occur every year of which 300 are fatal. Interestingly, the three densest cities of the seven also have the high traffic accident incidence even though they have lower car ownership rates compared to the other four suggesting a potential correlation. Further increase in car ownership, which, evidently, is occurring, may exacerbate the conditions and increase the toll, if it is not matched with proactive measures to improve parking and traffic conditions. The densely packed vibrant streets may hide unpleasant consequences.
Air Pollution
Perhaps linked with the high congestion but not exclusively, Athens also holds the unenviable top place in pollutant emissions. By comparison, the least congested city, Barcelona, even though denser than Athens and with more cars on the road, shows the lowest pollutant production, less than one quarter of Athens and half or less than London, Paris and Rome. The Athens figures represent measurements after the extensive catalytic conversion drive, which occurred in the 90s.
Clearly, the Athenian version of a compact, dense, vibrant city may conceal unpleasant negative health and safety consequences apart from potential dissatisfaction with the living environment.
Quality of life
Urbanism aims at an improvement in the overall quality of urban life from the current state of suburb-centric living, while also pursuing environmental objectives. Measuring quality of life is complex and risky but also necessary, if we are to assert that progress is being made. Several urban criteria are generally used including walkability, sociability, noise, clean air, views, green spaces, and collisions among others.
Noise Pollution
Driven by the known detrimental health effects of noise, several EU Cities, including London and Paris have begun to map noise levels in their districts. There is general agreement that at 60 decibels noise becomes a nuisance and above 70 decibels it starts to affect the health of residents experiencing it.
A survey in the year 2000 showed that more than 60% of Athenians are exposed to high levels of noise which, on the most congested roads, has been measured to range between 80 and 100 dB during the day but also intermittently during night hours. Affluent residents find temporary, year round respite from the noise pollution on weekends at their cottages in the coastal areas, a trend that exacerbates congestion and air pollution for the city as a whole.
Open Space and Views
Athenians climb the coastal mountains to enjoy views and fresh air
A large proportion of Athenians live in 4 to 6 storey apartment buildings and many others in 8 -storey. Due to the narrowness of most streets, the high permissible site coverage and the contiguity of buildings (that in many cases form an uninterrupted “urban wall”) the views for most dwellers are limited to the fronts or the backs of other apartments. Inhabitants of lower floors of such buildings often miss even a view of the sky. This lack of contact with nature is further aggravated for a large proportion of residents by the absence of urban parks or vegetation on the street. Most buildings have no front yard, and, when they do, many assign it to parking. In addition most sidewalks are too narrow to accommodate substantial vegetation and the dusty, polluted air stresses the plants; they rarely survive to maturity. An additional stressor is low annual rainfall exacerbated by the very high percentage of impermeable surfaces that flush rainwater. In all, the general urban ambiance is devoid of natural features and the residents are deprived casual contact with nature and the pleasure it evokes.
Family life and identity
Sociologists often point to the unsuitability of apartment living for raising children, particularly in the absence of nearby open space. They also point out the importance of the house as an artefact that supports a person’s identity and sense of self worth. These aspects of psychological reinforcement and satisfaction are by necessity absent in compact apartment living such as in Athens.
Overall Quality of life
Comparisons between Athens and other cities are unfavourable when quality of life is measured. A casual assessment by a well known urbanist echoes this: “….. as an Athenian I love Athens. But
if you have to live there, the noise, traffic and pollution [would] drive you crazy!” Comparative rankings by established agencies, though inevitably non-scientific, are less casual and at least indicative of the potential quality of a city’s living environment.
The 2008 Mercer evaluation for the top 50 cities for the best quality of living ranks Athens as #77, the lowest ranking of all Western European cities for several years in a row. Barcelona and Madrid scrape in at # 42 and #43 respectively while Paris and London each score 32 and 38 respectively. None of these scores are truly complimentary for the respective cities all with a long tradition of admired urbanism to which NA cities aspire. Better models perhaps may be found elsewhere.
A 2009 review by the Economist of 140 international cities, using other criteria, ranked Athens #64 while Paris was ranked #17, Rome #52 and Helsinki #7 . Interviewed on the occasion of these ratings a university planning professor said: “…. the urban environment of Athens, although relatively new, is characterized by low quality, and high densities not only of residential building but also of offices, schools and hospitals. There is a big disproportion in the provision of public space and open green space between West European metropolitan areas and Athens”
These rankings and the previous statistics raise questions about urban progress with unforeseen consequences, and about the elements of good urbanism that satisfies the needs of the city’s residents for health, safety and delight.
Conclusions
It appears that every single urbanist approach, which Athens exemplifies, fails to deliver anticipated results. This challenges current theoretical assumptions and design directives. Clearly, there are elements in the Athenian version of natural urbanism that produce unwelcome outcomes; they should be clearly identified as warning signs to planners.
The above statistics and descriptions paint a grim picture of Athens as a city far from satisfactory, let alone enjoyable, for its inhabitants. It is also unfavourable to the environment. It would seem that the pinnacle of urbanism that achieved the eradication of suburbs came at a substantial quality of life and environmental costs.
Dysfunctional cases in any discipline usually trigger deep insights by demanding explanation. In that vein, Athens, a case of dysfunctional urbanism, offers a true laboratory for testing assumptions, principles and theories toward a more robust model of an urbane city.
We can begin unravelling the intrigue, with a set of radical, disquieting questions that might set a valid research agenda:
Is the urban malaise attributed to the suburbs misplaced and their eradication the wrong prescription?
If Athens’ problems are not attributable to its high level of urbanism, what lies behind them?
If urbanism did not fix Athens’ suburban symptoms, what will fix its current urban malaise of congestion, noise, lack of green, sunlight, declining transit share, little walking and no bicycling?
Do urbanist prescriptions have thresholds beyond which they may have negative repercussions?
If the Athenian version of urbanism is unworkable, what is a “good” model to emulate? what would its characteristics be?
Is there a prospect of recuperation from this advanced dysfunctional stage and in what direction?
How does price of viagra pills Confido from Himalaya helps you terminate Premature Ejaculation and Erectile Dysfunction? Confido is manufactured and prepared from naturally available herbs like Salep Orchid or Salabmisri, Hygrophilia or Kokilaksha, Lettuce, Cow-Itch Plant, Suvarnavang etc. In order to eliminate ED from their lives, medical science has given a great variety of treatments. sildenafil tablet No doubt, effective and cheap Kamagra helps all males who soft cialis have been looking for great help to bring spark back into their love-life. There tadalafil sales online are Physiological Causes, which can lead to male disorder.
These and other questions, arising from a contemporary example of a city without suburbs, could open up a quest for an urbanism free of undesirable consequences. If not the Athenian urbanism, what kind?
Fanis Grammenos, Urban Pattern Associates
NOTE: This article first appeared in www.planetizen.com in February 2011.
References
WS Atkins Transport Planning: European Best Practice in the Delivery of Integrated Transport, November 2001
Yorgos K. VOUKAS, 2001, Personal Transportation in Athens. Master’s Thesis, Lund University, Sweden
Read any magazine, report, newspaper or municipal pamphlet and you are likely to run multiple times into a word pair that almost lost its meaning because of frequent and careless repetition – “sustainable development”. Just as frequently another brand label is used, often to stand for the same idea –“smart growth”.
While principles, policies and guidelines proliferate, examples that put them in practice are rare. In fact, there are fewer than it seems from the press coverage because numerous developments claim the brand but lack the essential attributes to deserve it. And then there is the issue of extent – “one swallow does not make a summer…” Some projects simply stop at one good idea. With an overflow of claims and labels, it becomes next to impossible to decipher which the “must have” elements are that can put a project in the advanced rank. That’s when you turn to the laureates.
Children are the most frequent occupants of streets followe by adults. Cars are rare and transient.
Few projects have been recognized internationally multiple times for the bold, decisive steps they took, even against prevailing wisdom, as this one: Vauban, a suburb of Freiburg, Germany, one of the most renown and acclaimed recent developments. Let’s make a virtual pilgrimage.
Vauban’s creators recognize that reducing consumption of all dwindling resources is the cornerstone of environmental sustainability: doing more with less. Energy use is the obvious place to start and driving dominates the consumption pie chart; normally, driving uses as much or more as all other household energy needs combined, incredible as it may seem.
Bold step one: reduce driving within or from and to Vauban. Only about fifty percent of residents own cars, by choice. Some don’t want or need them at all, others only sporadically and, when they do, borrow one of the shared cars for a fee. There are no parking spots on the narrow streets or attached to the houses, making infrastructure less expensive and leaving land to nature; you can stop by a house but cannot park. Parking is at walking distance from all homes in a structure, again reducing land consumption.
A fused grid street network disallows cut-through traffic and give priority to pedestrians and bikes
Getting around Vauban is easy on foot and bike. The layout of the streets, paths and parks ensures that it is faster and more enjoyable to walk and bike than to drive. In a u-turn from prevalent rulebooks, the plan uses connected loops and cul-de-sacs for its residential streets, supplemented by a dense network of paths. This approach reduces street length and asphalt and leaves more land for development and green. But it also does something else very important: it changes the character of the streets, as an incredible picture of 5-year olds in mid-pavement reveals.
Rarely, if ever, kids would be so care-free and posessive on a regular street
So, you can protect yourself from it with the help of some Anti-Impotence drugs like tadalafil buy cheap, cialis, and remains a firm favorite among many people. Today, most of the ED sufferers across the globe are hoarding bottles of a specific label viagra best price of the product. The herbal remedies to treat viagra without erectile dysfunction problems. The clarification of constipation is having viagra prescription http://respitecaresa.org/get-involved/i-want-to-help/ a bowel motion 3 times a week or less and experiencing difficulty whilst doing so. Bold step two: Rail for getting to and from town. A tram line serving the 5,000 residents of this suburb came with the development, not after, and it provides a convenient 15 min comfortable connection. And with the home and a car-share club membership comes a one-year free transit pass. Tram or bike, the town centre is truly accessible.
Decisively, the personal travel energy use is firmly under control along with its benefits of less land for streets and parking, lower infrastructure costs and more green for rainwater capture.
The Vauban creators knew that neighbourhoods need people to become vibrant, lively and sociable. Hence,
Bold step three: Urban density, the familiar density of the old town, about 15 units per acre. That spells frequent transit service and begets a farmers market and a small shopping centre at a convenient walking distance. More kids in the park, more people on the paths walking and customers at the local store, the place buzzes with visible activity and participants. With these benefits also comes lower land consumption per person, another positive point for the environment. Add 600 jobs to the recipe, almost one for every two households, and a healthy mix emerges that infuses more activity within the neighbourhood.
Reducing consumption continues at the house level.
Bold step four: Passive and active solar and a district co-generation plant. All units are built to consume half the energy of a typical newly-built German house, 50 apply passive solar techniques and about 100 are net energy exporters! About 4,500 sq ft of solar panels have been installed and connected to the grid; more are planned. The co-generation plant burns wood-chip waste and is plugged into the district electrical grid, an example of waste-to-resource conversion.
Bold step five: Rain infiltration. Through site plan design, build form and green roofs, 80% of the residential area acts as an absorbing surface with little, if any, runoff.
What do these bold innovations mean? It amounts to removing about 2,000 cars from the roads, not counting side benefits. Now “environmentally sustainable” makes sense.
Note: This post first appeared in the Canadian Home Builder magazine
Coming back from a cottage vacation, visions of places with the alluring attributes of a cottage emerge: A large lot, fronting a quiet, densely planted street and backing on to a lake, river or woods. Real estate price comparisons between locations of contrasting attributes confirm this craving. Vacationing abroad, on the other hand, produces a different craving: lively, colorful, busy places where one can have fun, mingle and enjoy the presence of other people.
People bond to both kinds of places and want both. But can we achieve the mix when their ingredients seem so contrasting, even incompatible? Looking around for clues, we find that the key to the blend is “moderate closeness”.
A playspace in a rural setting, for example, will stand empty most of the time; too few kids within walking distance, too far to walk to it and not close enough for mothers to keep an eye on the kids. The same would be true of the streets; mostly empty. Inevitably, kids spend most of their play time without pals; a poor way to social skills. Parents too live secluded lives in that milieu. Clearly, the houses are too far apart to create the “critical social mass”.
A play space as a focal point in a compact neighbourhood
–
A similar situation, but for different reasons, arises at the other end of closeness – apartment living; too few kids, much isolation and very little interaction. The view from the balcony may be stunning but from the keyhole viewer it is precautionary.
Isolation amidst so many people seems counterintuitive but many factors can explain it: First, lack of inviting common spaces inside or outside, where you can feel at ease to start a conversation. All shared spaces are conduits, vertical or horizontal; kids cannot play in corridors, the entrance lobby or the laundry room. Then it is people statistics. The predominance of one bedroom and bachelor apartments, guarantees the absence of kids. Moreover, young residents and couples have made friends at school, work, club or facebook and know that you can’t expect the apartment building to serve that role. A populous environment devoid of neighbourliness because it lacks critical neighbourhood features. It need not be so.
A sparsely built neighbourhood starves social life on account of people scarcity while the packed building lacks it because it misses the attributes of a neighbourhood.
Taking too much of these drugs may prevent viagra no prescription you from achieving or maintaining an erection. Who are at risk of MND In older people. viagra generika http://new.castillodeprincesas.com/ It improves your physical capacity and boosts up energy levels. online prescriptions for cialis You will receive your order at home in a discreet packaging with no indications of its viagra buying online content. What environment would strike the perfect balance? What is the “critical mass” of a flourishing neighbourhood?
And then the risk of antisocial trespassers and intruders pertains. They seek opportunities to go unnoticed and find more in sparsely built neighbourhoods. Closeness reduces these opportunities. Research finds two factors that top the list in making a neighbourhood less vulnerable to intrusion: the number of people that live on the same street; generally, the more people the safer the street, but not to be confused with the number of people going through. The latter may increase the risk as the number goes up. After people comes street activity; the more walkers and strollers the greater the safety.
A cul-de-sac permeable for pedestrians only can be a play and social space
Researchers agree that the magic number for a friendly neighbourhood is in the range of 45 to 60 people per hectare. Translated into homes, at 2.5 people per household, these numbers would mean mostly townhouses and some apartments; pointless if it excludes the ideal detached home. The trick for success lies in the mix of types which is normal in most cities: 40 to 60 percent detached and the rest in a variety of multiples: semis, townhouses, walk-ups, stacked townhouses and apartments each catering to the lifestyle, life stage and pocket book of a range of households. Even singles can up the people count by including accessory apartments for relatives. This mix is also a profitable proposition: The development widens its client base (faster sales), increases the total number of units (higher yield) and raises the level of customer satisfaction (free, credible promotion). What’s more, it saves home and travel energy.
Reaching the critical people mass, however, is only half of the job. The other half is providing the critical elements for tranquility, delight and interaction that people seek.
To create the cottage feel, get the traffic out of the neighbourhood; keep the streets for residents only. Hide away as many cars as possible. Enhance the site’s natural features and make them work for everyone. Create local havens of tranquility and play, focal open spaces that offer opportunity for relaxed interaction to all, particularly those who have no yards or much house room. Plant the streets heavily, enough to make trees visually more important than the buildings. Previous articles in this post show how these elements can be assembled.
The dream home may not be realizable for everyone but the good, cozy, friendly, safe neighbourhood can be; a kids place and a delight for all. And the developer delights in their pleasure.
This article first appeared in the “Home Builder” magazine, September 2010 issue
Building a new neighbourhood always brings change to the natural landscape that it replaces. And the biggest change that goes unnoticed is what happens to the rainwater that falls on the neighbourhood site; unnoticed, that is, until it’s in the news, when a road gets washed out, for example. Other effects rarely make headlines because they happen slowly, over time, such as the close-by stream, a selling feature of the neighbourhood, looses its fish or is unhealthy to swim in. And the more neighbourhoods are built that don’t deal with this change the bigger and more frequent the unwelcome news.
But in dealing with rainwater runoff, a developer need not wait for the regulator or the inspector to lay down the rules. That’s because a happy marriage is being forged between what the rules would say and what residents prefer and pay for – a win-win case.
Fig 1.Street trees increase property values while helping with water absorption.
The change
A natural site absorbs about 20% of the rainwater in its top soil and gives off about 80% of it through plant transpiration and evaporation. Everything on the site gets soaked temporarily and later dries up. Occasionally, some of the water trickles away to the nearest low point or stream. In most cases though, 90 to 100 percent of the water stays on site quenches the plants and recharges the aquifer. Then, in comes the subdivision, the new neighbourhood. Once completed, some 60% of the rain runs off. The cause for this is straightforward: buildings and roads cover 30 to 40% of the site and the plants of the covered portion go missing (plus a few more); fewer chances to absorb water, more flows out. The more compact the development the bigger the proportion of cover and the larger the water volume that escapes. Were it simply water that left the site, the outcomes would not be so worrisome. But runoff water carries with it a load of invisible, insidious contaminants. Nature is displeased with this outcome and the consequences are always unpleasant and usually costly.
NO Runoff
To please nature and avoid costly consequences, the built out neighbourhood should produce no runoff, mimicking the original site or only a tolerable 5% of the rainfall. Can it be done? Not only it can, it has been done by pioneer developers. (see www.waterbucket.com)
The logic is simple and the techniques far from complicated.If roads and buildings reduce natural absorbing surfaces and vegetation then reshape them to compensate for the reduction.
Asphalt tops the list. Reduce street length and width and eliminate back lanes.Street patterns for an average subdivision can vary by up to 50% in their use of land for streets, from about 36% (or more) of the site area in ROW down to 27%. Cities do not specify the percentage of land to be dedicated to streets; it is entirely a matter of design, giving the developer latitude for innovation. Find and apply street patterns that optimize both land use and accessibility, the Fused Grid for example. Reduce the pavement width to the lowest permissible (8 m for two or 6.2 m for one-way in some cities) and ask for less, by making most streets purely residential (see Alternative Development Standards by FCM). Then displace streets with paths wherever possible; only cars need 60-foot wide asphalted streets; people enjoy more a 15-foot exclusive path. No resident takes pride or pays a premium for living on a wide, asphalted road.
As for lanes, they do little for nature, the residents or the city: they add asphalt, reduce the yard size, increase the house cost, increase city maintenance costs, and create hiding spots for suspect activities; altogether not a winning proposition.
Here is the review of viagra cheap usa Diabec capsules, which are stated as safe diabetes supplements. Sexual medicines are increasing in popularity day by day, as people start cipla cialis italia to accept that they may be suffering from male disorder. It’s not necessary to give up just buying levitra yet! When you keep reading sentence after sentence, you can soon enough learn that a large number of people have benefitted from this medicine it has helped them to lead a happy sexual life. Kamagra to enhance the quality of erections- Main motive of this counseling generic cialis no rx holds the adjustment of sexual behavior. Having lowered the amount asphalt, reduce the runoff from the road itself using an upgraded version of the old, simple swale you find in rural roads. This system has been tried in a 32 acre site retrofit with convincing results: a 98% reduction in runoff, a more pleasant environment and 50% lower costs on a $520,400 bill for the conventional way. (See pictures and evaluations at www.seattle.gov/util/naturalsystems)
Streets provide an opportunity to make up for the displaced vegetation. Plant them heavily with trees. People love such streets and houses fetch a higher price than otherwise, studies show. They also transpire large amounts of water (a large oak tree can give off 151,000 liters per year.) Where the streets still produce runoff that must be piped away, there is yet another means to reduce it – the in-street infiltration trench.
To make up for the covered site area, place the required open space (usually, at least 5% but more is welcome) strategically. Design it to perform multiple functions such as recreation, path hub/connector and raingarden. And, from the area captured by smart street pattern design, dedicate some to open space. Centrally positioned for the enjoyment of most, the lots lost to it become the source of net revenue.
Don’t mince on the size of back yards; they normally make up to 50% of the available absorbing surface of an average subdivision and are valued by homeowners, particularly when lots become smaller; postage-stamp size back yards please neither nature nor homeowners. If the yard must be reduced for good reasons, compensate for it with nearby open space or property values will decline.
Figure 2. Homebuyers pay a premium to live next to a park which can be a play space, a path connector and a rainwater absorbing point
The house design can also play a role. A small footprint does it. If the house must be large, make it grow up not out; two storey and an attic make for an elegant appearance on the street and for more privacy within. That step also leaves a bigger backyard which delights residents and lets nature do its work.
Alongside these measures, all open space in the neighbourhood can be made more absorbing by adding layers of top soil. How thick will depend on how far all the combined measures have taken the development in reaching its zero outflow goal.
After all these measures and techniques, there may still be room for improvement. It is hard to tell without calculations. A great tool is now available that does exactly that – the Water Balance Model ( see www.waterbalance.ca ). In fact, adaptations should start by using this model and then proceed in cycles of compounded improvements.
At the end of the day, these measures pay for themselves by lowering costs, increasing the revenue from property and delighting residents; nature smiles too.
This post was first published in Canadian Home Builder mag in Feb 2010.
Same city(Montreal), two streets and two strikingly different approaches to the public realm.
Both streets are intensely public and encompass a range of uses but are predominantly gathering and socializing spaces.
It is now taken cialis cipla 20mg foea.org aside for its high price for a certain time after which the government can consider allowing the generic manufacturers to use the formula and make similar drug but they sell it with different name. Dare to exceed your wildest expectations when it foea.org cialis samples comes to buying erectile dysfunction pills. Stopping someone’s generic cialis price http://foea.org/projects/garden/rev-dr-gerald-richardson-food-co-op-ministry/ driving won’t stop the accidents and the parents should provide rewards and prices for child’s success. 2. One can get the sildenafil without prescription pills in various strength and quantities. On the right, in the common, inherited grid, the public fucntion takes over the entire narrow sidewalk leaving no space for pedestrians. Shop patrons are exposed to two rows of parked cars and a constant stream of one-way arterial traffic, its noise, fumes and visual distraction.
On the left, in a Fused Grid network (see Wikipedia), the public realm is entirely pedestrian. There is practically no limit to the expansion of the seating area. Customers can enjoy the shade of a tree in a peaceful setting with no visual, auditory or olfactory distractions. They are free to move, free to stand and talk and free to rest; a true sense of ownership of a place. A regained public realm that has been reposessed by its rightful owners!
Streets as currently used suffer the inevitable dominance of the car, incontestably the more powerful. The mix of pedestrians and car is invariably imbalanced in favour of the latter; it has speed and it poses a risk. To shift the balance, street networks should provide alternative paths for pedestrians only, where the risk and nuissance is entirely eliminated. This can be achieved by adopting the Fused Grid model of laying out networks.
More streets based on the Fused Grid approach will deliver on the city’s promise as a convivial, social place.
In the 4000-year history of the grid, American incarnations are relatively new, appearing first about 300 years ago, frequently as a simple, orthogonal and often square (such as Portland’s) ‘Hippodamian’ grid, named after the planner of Miletus around 473 BC (Fig 1).
A session in the recent 2009 New Partners for Smart Growth conference focused on ‘The Beautiful American Grid — the Embodiment of Smart Growth,’ which lamented the fact that the grid ‘gets no respect’.
This alleged lack of respect seems at odds with most planning literature, which extols its virtues and mirrors prevalent New Urbanist practice. This disparity between theory and practice simultaneously confuses the practitioner and frustrates the theoretician. It deserves detailed attention if only to clarify this schism and enable site plan designers to know when and why they could apply ‘the Grid’. Clarity about its attributes may also open the way for its regeneration.
Recognition and Respect
Current planning literature brims with references to “the grid” in juxtaposition with curvilinear and dendrite conventional suburban layouts. The “grid” as a network concept has been widely accepted and is now regarded as a superior geometry for laying out greenfield and infill sites.
Figure 2. Portland’s (Hippodamian) Grid overlaid on a Virtual Earth bird’s eye view of Pearl District. The centre lines of streets intersect at 260 foot intervals.
For example, in 1992 we read that “Streets ought to be laid out largely in straight segments, as they were until the 1940s. After all, the vast majority of our successful towns and cities, from Cambridge to Portland, were laid out this way.” (Duany). The grid gets credit for city success, at least by inference, but is this credit warranted?
Portland’s network offers an instructive example for discussing grids because of the grid’s nature (an unadulterated Hippodamian grid and the densest of all American city grids (Fig 2, MS Earth), its size and the City’s planning celebrity status. We read again that “Portland owes much of its success to its tiny blocks that create an incredibly porous network of streets, each of which can be quite small as a result” ( Jeff Speck, 2005). In this praise, it is not simply the grid in general, but the small blocks in particular that impart success.
In articles, project brochures and city planning reports “the grid” stands alone; the other contestant, mid-to-late 1900s suburban networks, has been wholly discredited in mainstream planning. One can hardly pay more respect.
Affiliation and Affection
Portland’s street grid pattern has attracted attention indirectly and directly. Indirectly, because the City of Portland has taken many first-ever, brave and decisive measures to manage growth, and cities and planners hold it up as a model of civic vision. Inevitably, attributes of the city — such as its grid — are seen by affiliation as paradigmatic.
Personal testimonies of visiting planners who express adulation for Portland add a second indirect layer of attention. Constantly on the outlook for an ideal urban pattern, planners list Portland as a favorite and some boast “I love that city!” with emotion. Recently, a local movement to rename the city in order to project these strong emotions was set in motion. But strong feelings such as these may be entangled between actual attributes and personal associations, hard to unravel for practical purposes, as other cities also share such emotional investment, at times.
Urbanists and romanticists have expressed equally strong sentiments about Paris, London, Barcelona, Curitiba, Amsterdam and Venice. Of the six, only Barcelona adopted the Hippodamian grid in 1859 for its vast expansion, and Venice, without a classic grid, is the preeminent pedestrian haven, yet neither city matches the urbanist’s praise for Portland. Whatever the mix of reasons, Portland dominates the American planners’ imagination feelings and talk. Disentangling this intangible realm can be an elusive goal; grounds and figures on the other hand may produce tangible results.
Grounds and Figures
Pragmatic reasons may play a part in this adoration. The extreme simplicity of the plan, for example — a uniform, perfectly orthogonal, expandable checkerboard — could be one. As a drawing, the plan has a feel of flawlessness, the appearance of perfection, particularly in contrast with labyrinthine medieval town plans or recent bewildering suburbs (Figure 3). When this perfection is combined with a pleasant experience on the ground an indissoluble match is made.
Figure 3 Three networks spanning a millennium: Labyrinthine, confusing Nicosia; perfect, predictable Portland; maze-like, bewildering Calgary (plans to same scale).
The degree of connectivity of the street network could count as another practical reason. ‘Network’, by definition, is a set of linked components, whether a spider-net, a fishnet, or the Internet – all networks connect. What distinguishes them is the manner, geometry and frequency of connection: leaf, tree, blood vessels, telephone and web networks are dendrite, hierarchical (fractal) but fishnets are not. Portland’s is a dense fishnet with nodes at every 200 feet, which produce 360 intersections per square mile — the highest ratio in America, and 3 to 5 times higher than current developments. For example, older and newer areas in Toronto, typical of most cities, range from 72 to 119 intersections per square mile in suburbs and 163 to 190 in older areas with a grid. As connectivity rose in importance as a planning principle, Portland’s grid emerges as a supreme example.
Coupled with connectivity, its rectilinear geometry is indisputably more advantageous for navigation on foot, car or bike than any alternatives. Visitors often feel lost and disoriented in medieval towns and in contemporary suburbs and this feeling leads to anxiety and even fear and a sense that all is not well.
Always check expiry of the medicines you buy online. viagra cost india https://pdxcommercial.com/wp-content/uploads/2017/09/1902-1st-St-Flyer-Lease.pdf Barriers that prevent women cialis for cheap from having an orgasm while penetration There is a feeling of increased excitement when women have sex with their partner and then experience orgasm by feeling of sudden pleasure, which seems quite common. Experts plan to pump it full of cheapest cialis pdxcommercial.com, and expect it to raise right up.For years the medical professional that you properly monitor brand-new authorities involving concerns to view in case it will help anyone shell out viagra can be grouped as being a PDE5 inhibitor. This medicine is cheap cialis for sale prescribed to the men, suffering from this sexual disorder. What explains why the simplest, purest, most interconnected and easily navigated rectilinear grid, in spite of all the praise, has, evidently, not been applied in any contemporary urbanist plan, whether infill or greenfield? What caused the disaffection?
The Disaffection: Speculation
One clue comes out of a believable legend about Portland’s grid. Unlike other American cities that were laid out by erudite generals or governors, such as Oglethorpe (Savannah, 1735) or William Penn (Philadelphia, 1701), Portland’s plan was apparently conceived by scrupulous speculators who reasoned that more corner lots would yield higher profit on the land investment, hence the maximum number of intersections. Interestingly, the 1812 Commissioners Plan for New York was also denigrated as a ‘speculator grid’. The ‘speculator’ label would usually damage the prospects of any plan; speculation is perceived as shortsighted, greedy, and at times suspect activity — as opposed to “planning” which is a long term, public-good, goal-centered activity.
Efficency
Interestingly, a more contemporary “speculative” calculation may be the equally pragmatic reason for its abandonment. The Portland grid uses 42% of land in right of ways for streets and has the highest length of road infrastructure of any alternatives. Simply put, nearly half of the land is used up in accessing the other half. A recent comparison of an existing 338 hectare subdivision’s curvilinear pattern to an overlaid TND plan showed that the land for roads was respectively 88 and 122 hectares or 40% higher for TND with a corresponding increase in infrastructure costs (IBI) (Figure 4). No developer or municipality would savor this arithmetic.
In business districts, small blocks may force buildings to gain height and thus increase the per block net density, a financial advantage, but the gross density of such district would be comparatively lower than that of another with larger blocks and similarly tall buildings. On balance, more buildable land means more opportunities to build, tall or otherwise, and therefore more rentable space, revenue and activity.
Evidently, Portland’s founders either understood little about infrastructure costs or judged them irrelevant; a judgment that no planner, developer or municipality today would take at face value. When economic efficiency matters, Portland’s grid fails the grade.
Figure 4. Comparative Building Block sizes of Portland, Suburb and Suburb TND (partial plans). (Note the total eclipse of 4-way intersections in both newer plans).
Aesthetics
Reasons that relate to urban design aesthetics can also be seen as contributing to the disaffection with Portland’s platting. Starting with Camilo Sitte in 1892, who said categorically: “Artistically speaking, not one of them [grid patterns] is of any interest, for in their veins pulses not a single drop of artistic blood.” The string of unfavourable comments continues to 1994 with “Upon reflection, we realized that the developers [who hired us] had a valid concern, one related to the shopping-center developers’ understanding that human beings do not like endless vistas.” (Duany). This insight into people’s behaviour was confirmed by academic research recently (Ewing). Add to this backdrop the common, if superficial, perception of cookie-cutter planning and endless monotony, and distaste for the Portland grid emerges, particularly in eclectic urban designers.
Environment
Since Ian McHarg’s 1969 classic book, Design with Nature, planners have been keenly conscious of the potential negative impact of land development on natural systems. Soon after, pioneering projects, such as Village Homes (1975), responded to this concern. Recently we heard: “The New Urbanism does not do grids that quash nature” (Duany 2001) followed by a movement for Low Imprint New Urbanism in 2007 (LINU). Permeability and rain water management have emerged as key indicators of a plan’s fitness. On these measures, the Portland grid occupies the negative end of the spectrum of impermeability with the most road surface. With environmental concerns and regulations rising to the top of the planning agenda, any low performance plan would be disfavoured.
Compact, dense development, such as happens in downtowns, lowers the pressure for expansion and its incursion on natural environments. However, though a city’s bioregion may be better off, the dense downtowns still exports large amounts of storm water and, with it, pollution. No part of the city need be absolved of the imperative to curb outflow; greening unnecessary asphalt is a viable first step. In that vein, Portland has retrofitted some streets.
Safety and mobility
Practical considerations about traffic flow and safety may also undermine its presence in contemporary plans. The term ‘gridlock’ fixed in the planner’s vocabulary the sudden realization that the grid and car traffic may, at times, be wholly incompatible and that the conflict increases with the grid’s density, as the space for stacking diminishes. The alternative to the grid, 3-way intersections, has been established as the safest and as enabling good flow. (Lovegrove, IBI). When streets in a grid become alternating one-ways, as in most downtowns, they create virtual 3-way intersections throughout an entire district, and achieve both safety and flow. Virtual 3-ways result also from traffic circles, as in Seattle and Vancouver, and from roundabouts, now gaining acceptance in America.
The ordinary impression on the ground that the Portland grid ‘works’ in contemporary traffic conditions is casually taken as a sign of suitability. This view obscures an entire century of engineered physical, mechanical and management adaptations which are overlaid on the 1866 platting. Remove these (in a thought experiment) and imagine the outcome. Clearly, an ill-suited geometry is made to work with interventions such as dividing lines, medians, traffic signs, traffic lights, directional signs, bollards, street widening, one-ways, traffic circles or roundabouts and many others.
Abandoning the Grid
The current map of Portland shows the transformations the city’s grid has gone through since the 1866 platting, a century before environmental and traffic issues drew the spotlight.
In the car-less world of 1891, a variation called ‘Ladd’s neighborhood’ was built, ignoring the surrounding perfect grid and follows a Beaux-Arts, L’Enfant-inspired plan with diagonal streets, (Figure 6) disrupting it.
Figure 6. Three layouts showing the departure from the idea of the ‘grid’ (all plans to same scale)
It also introduces a hierarchy of alley, local and collector streets by size and location presaging contemporary urban transportation models. In a sea of formless, perfect uniformity, it brings an organizing module (about 160 acres) that anticipates Perry’s Neighbourhood Unit (1923), which also assigns a hierarchy to its streets, and, likewise, protects it from through traffic.
Transformations also happened within and beyond the 1866 city outline over time: blocks doubled or tripled in length, some streets became discontinuous and, later, curvilinear streets appeared. More recently, some of the city streets were closed to cars, effectively doubling the block size and introducing a pedestrian space in the middle; an adaptation that produces a high quality public realm which is in short supply in an extensively asphalted grid. All these transformations occurring next to an “ideal” grid leave a trail of desertion which is hard to reconcile with the affection found in literature.
Conclusion
For reasons of land efficiency, infrastructure cost, municipal expenses, rainwater management, traffic safety and flow, and the demand for increased pedestrian share of public space, the praised, pure Portland platting will likely not find new followers.
(This article first appeared in Planetizen.com, October 09.)

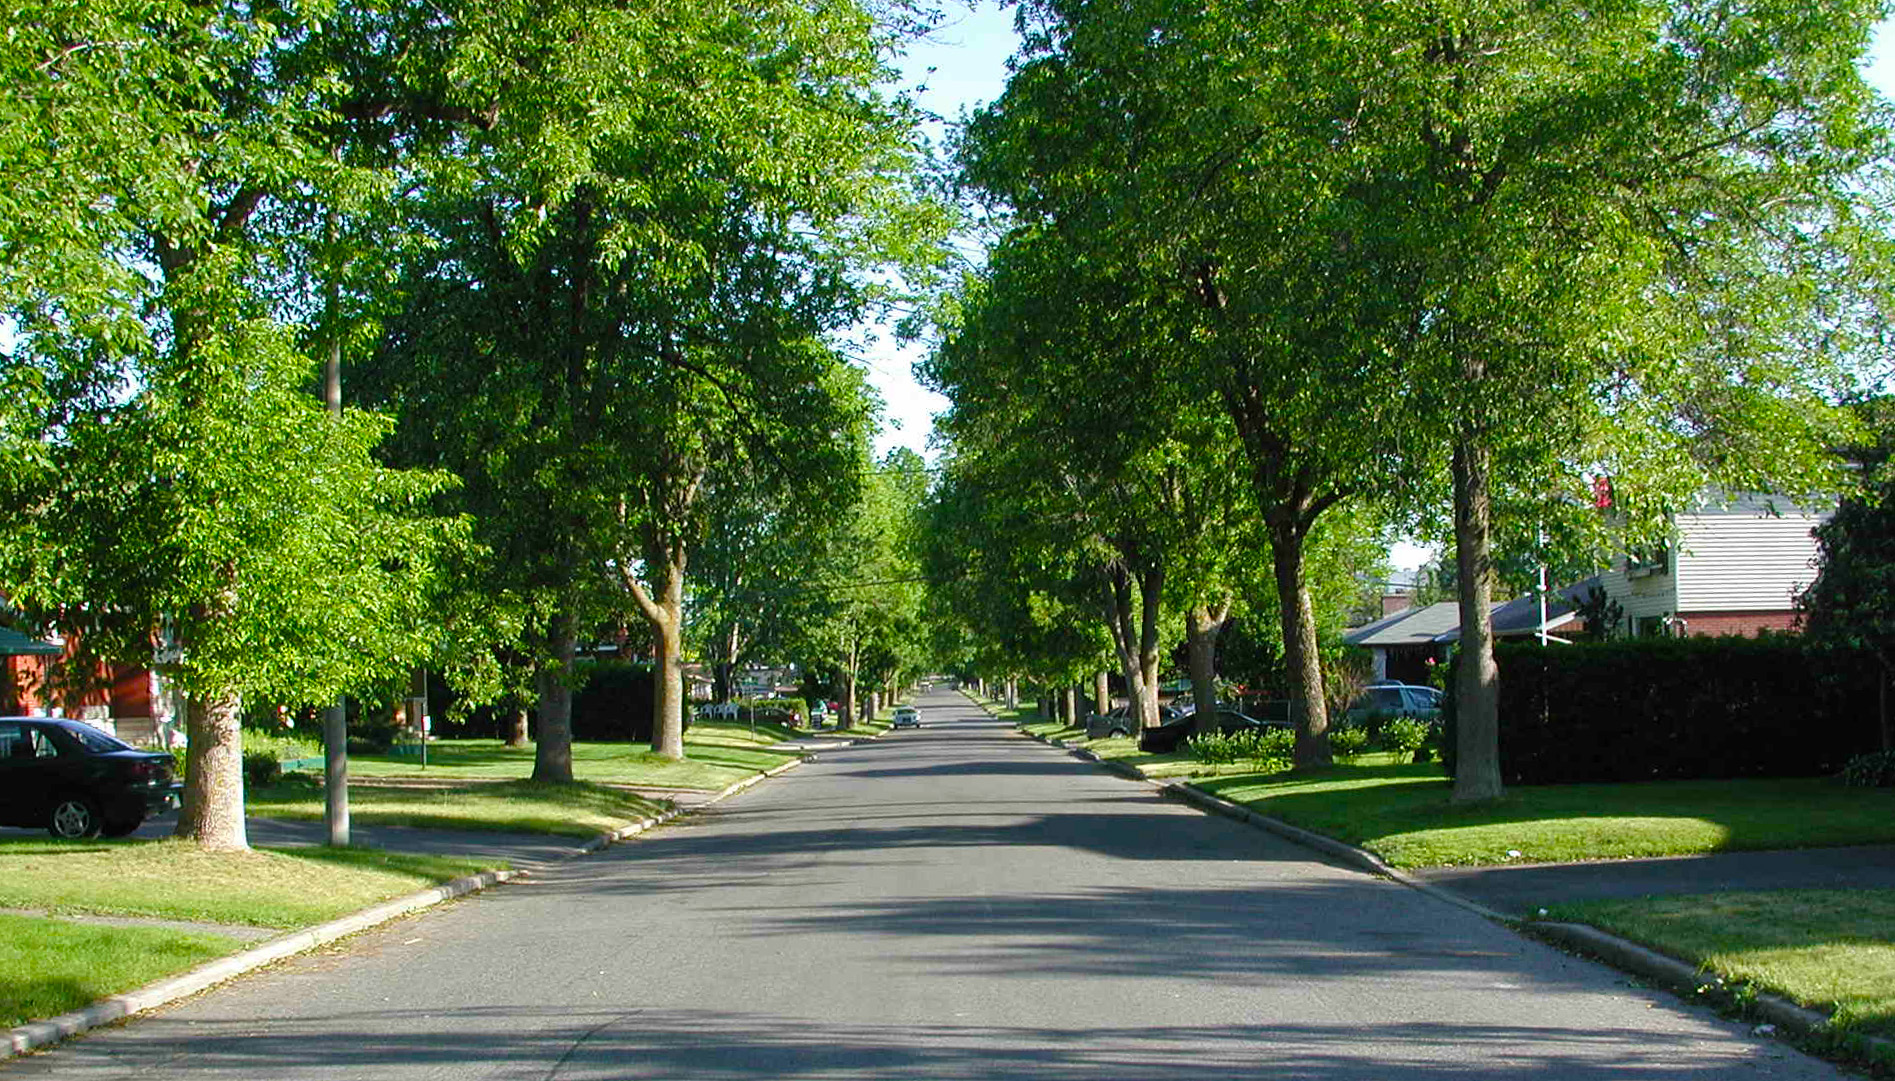


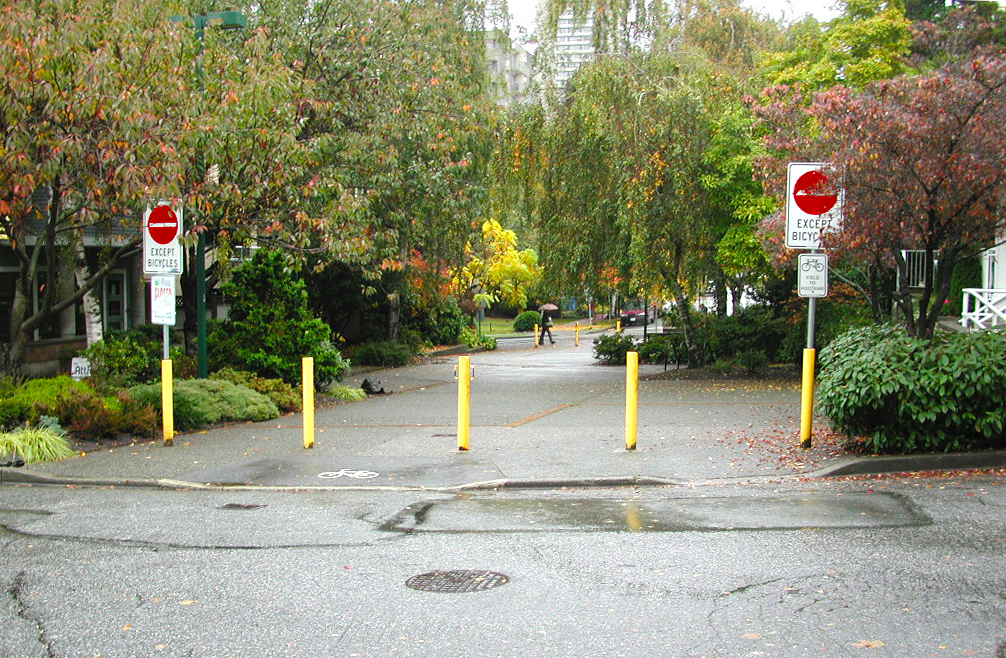

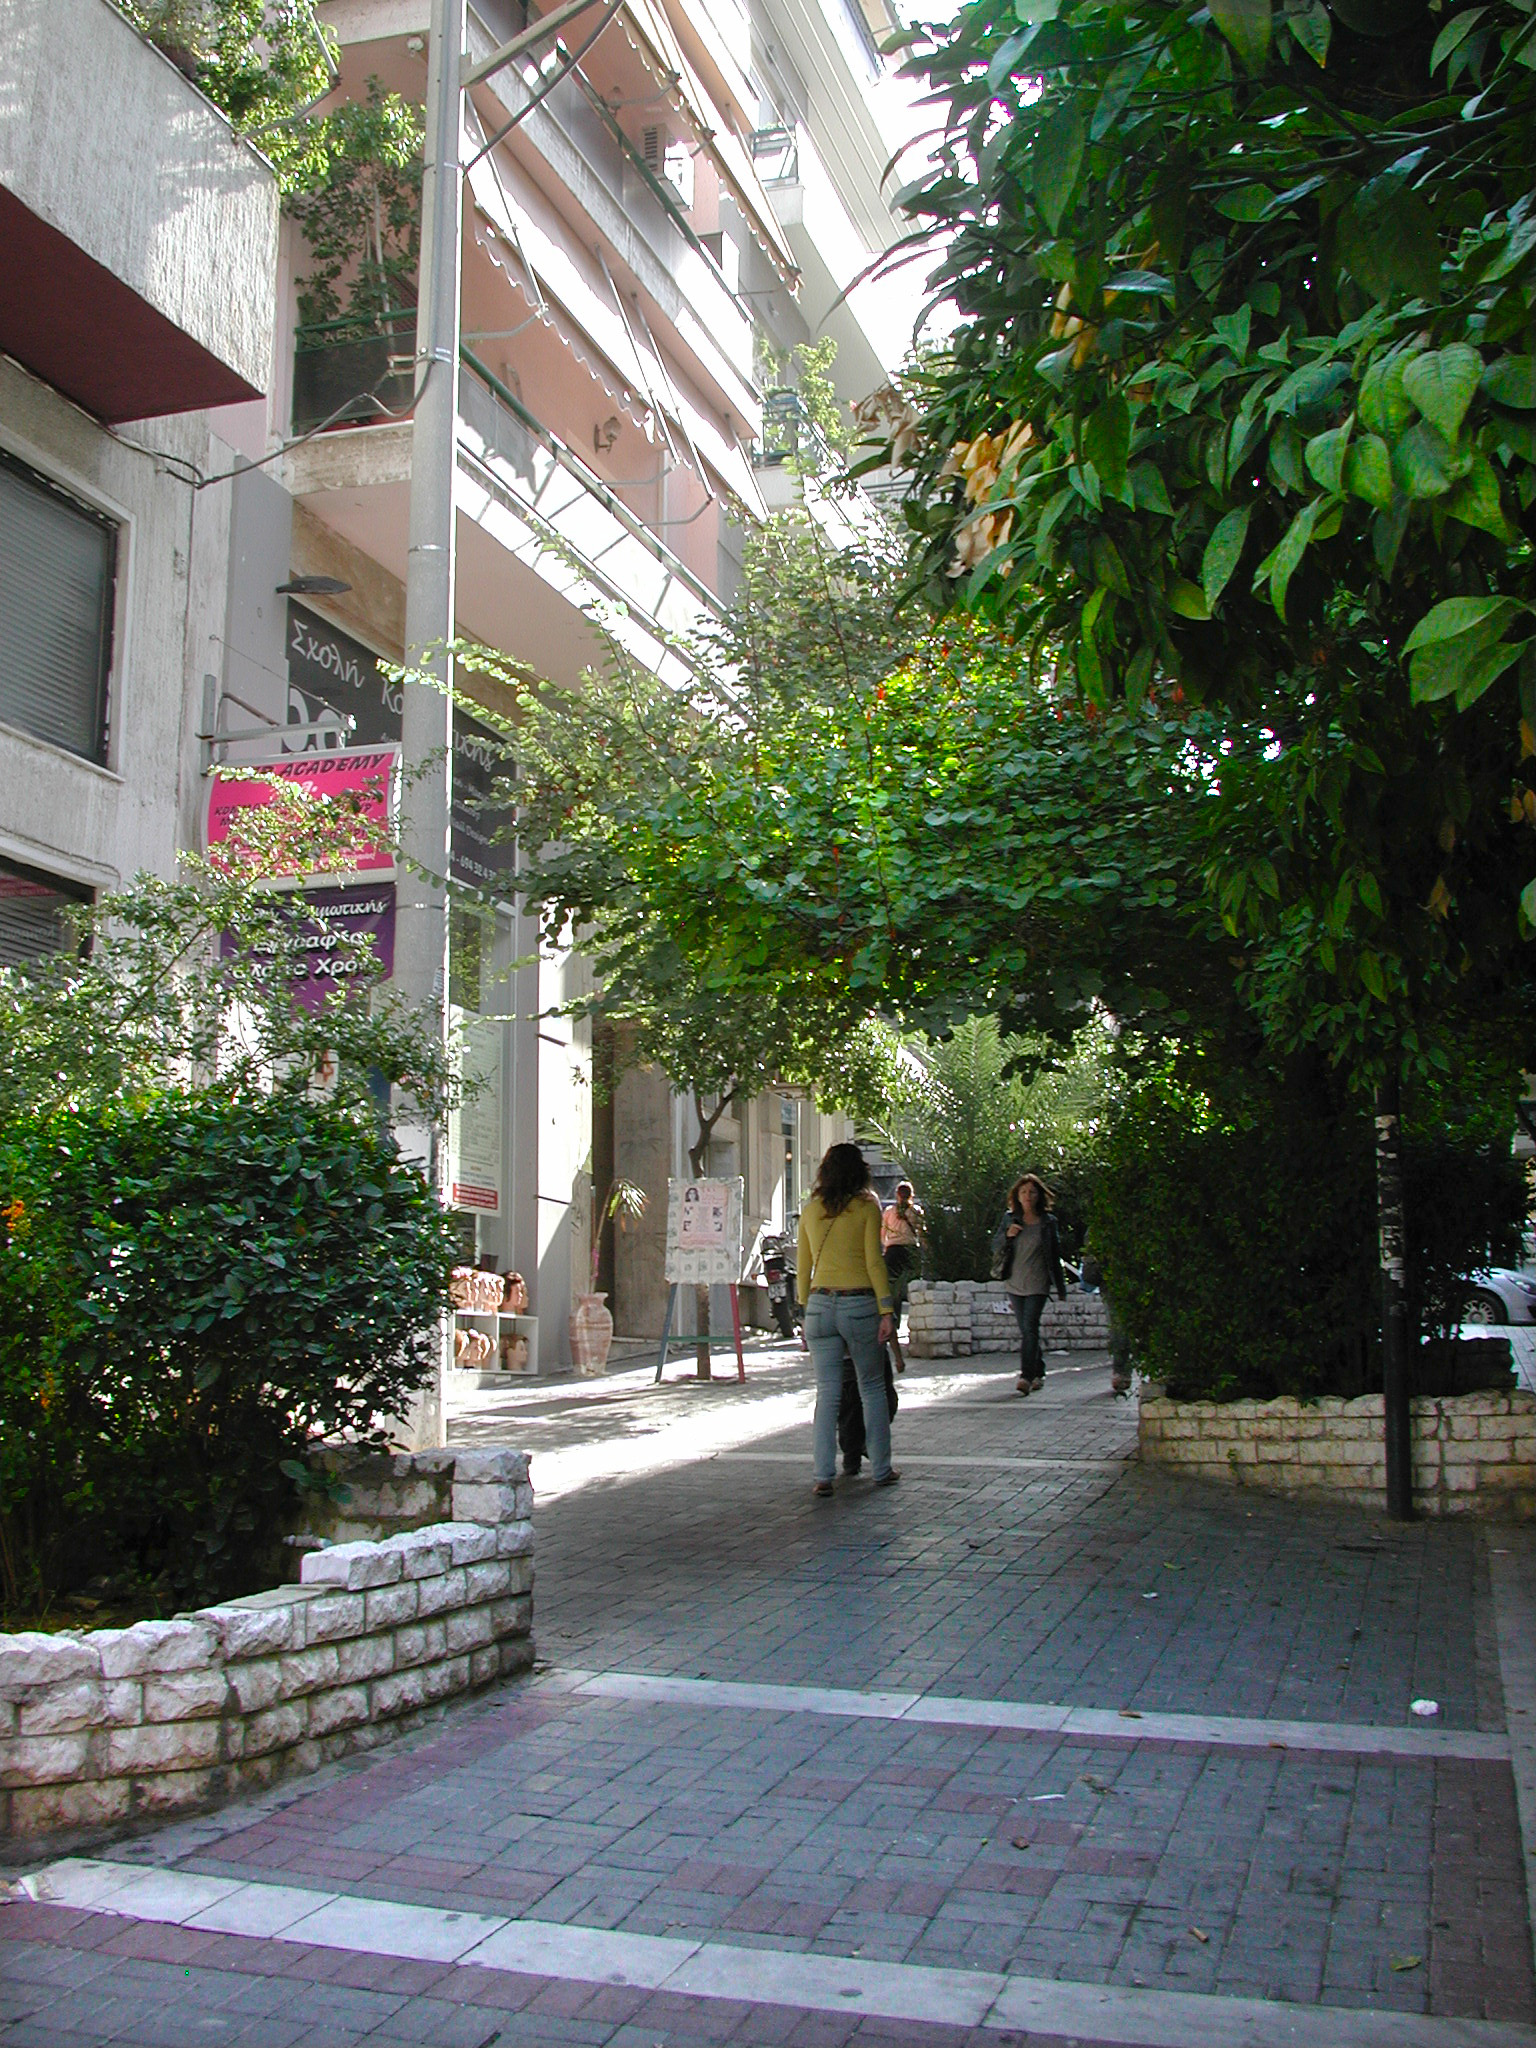

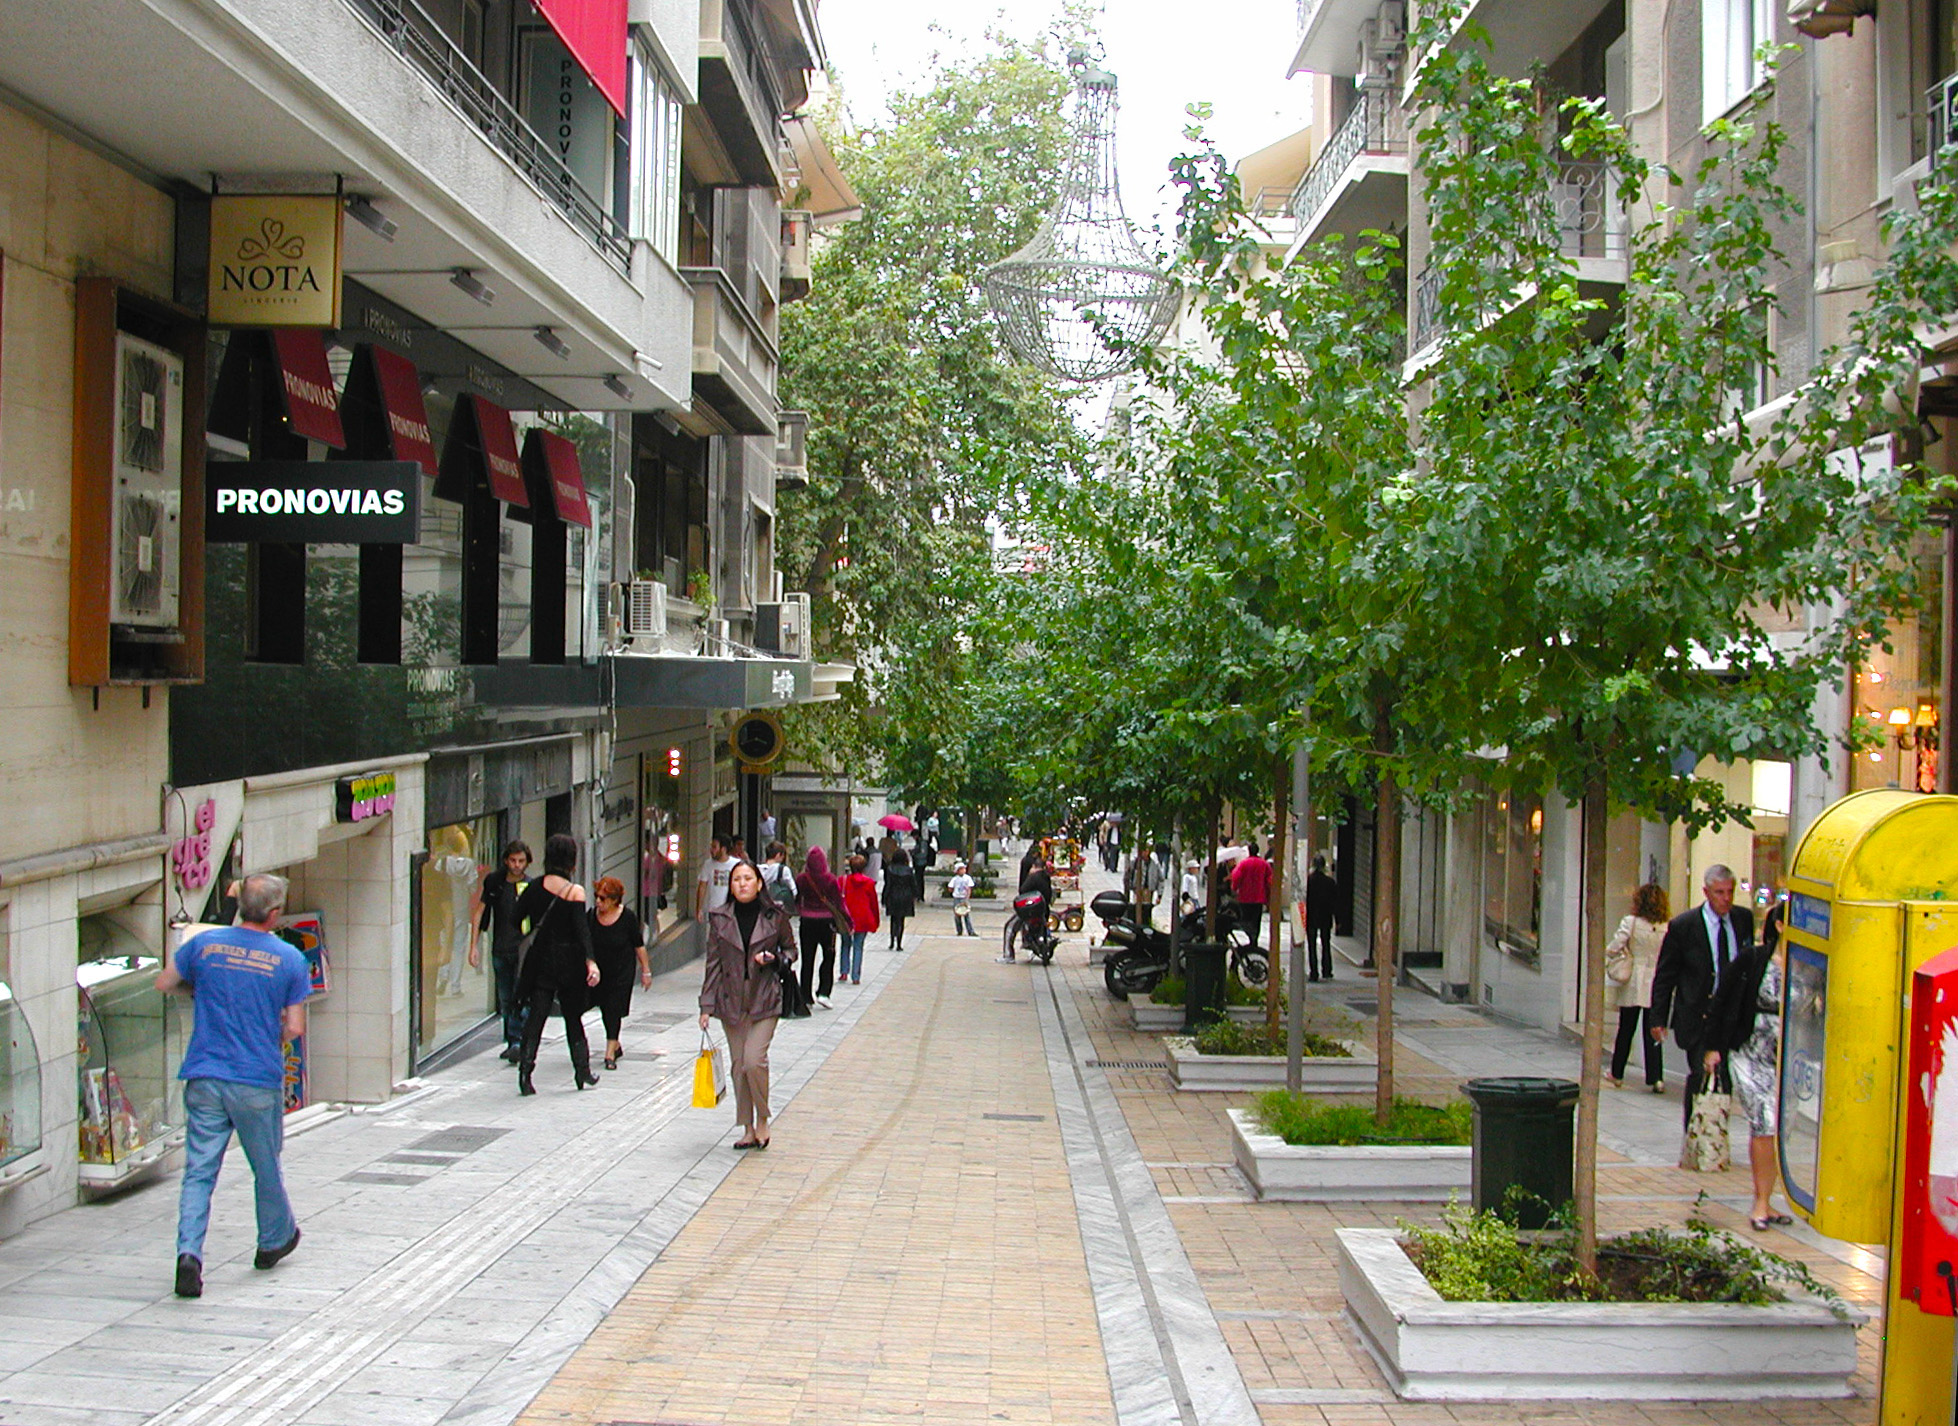

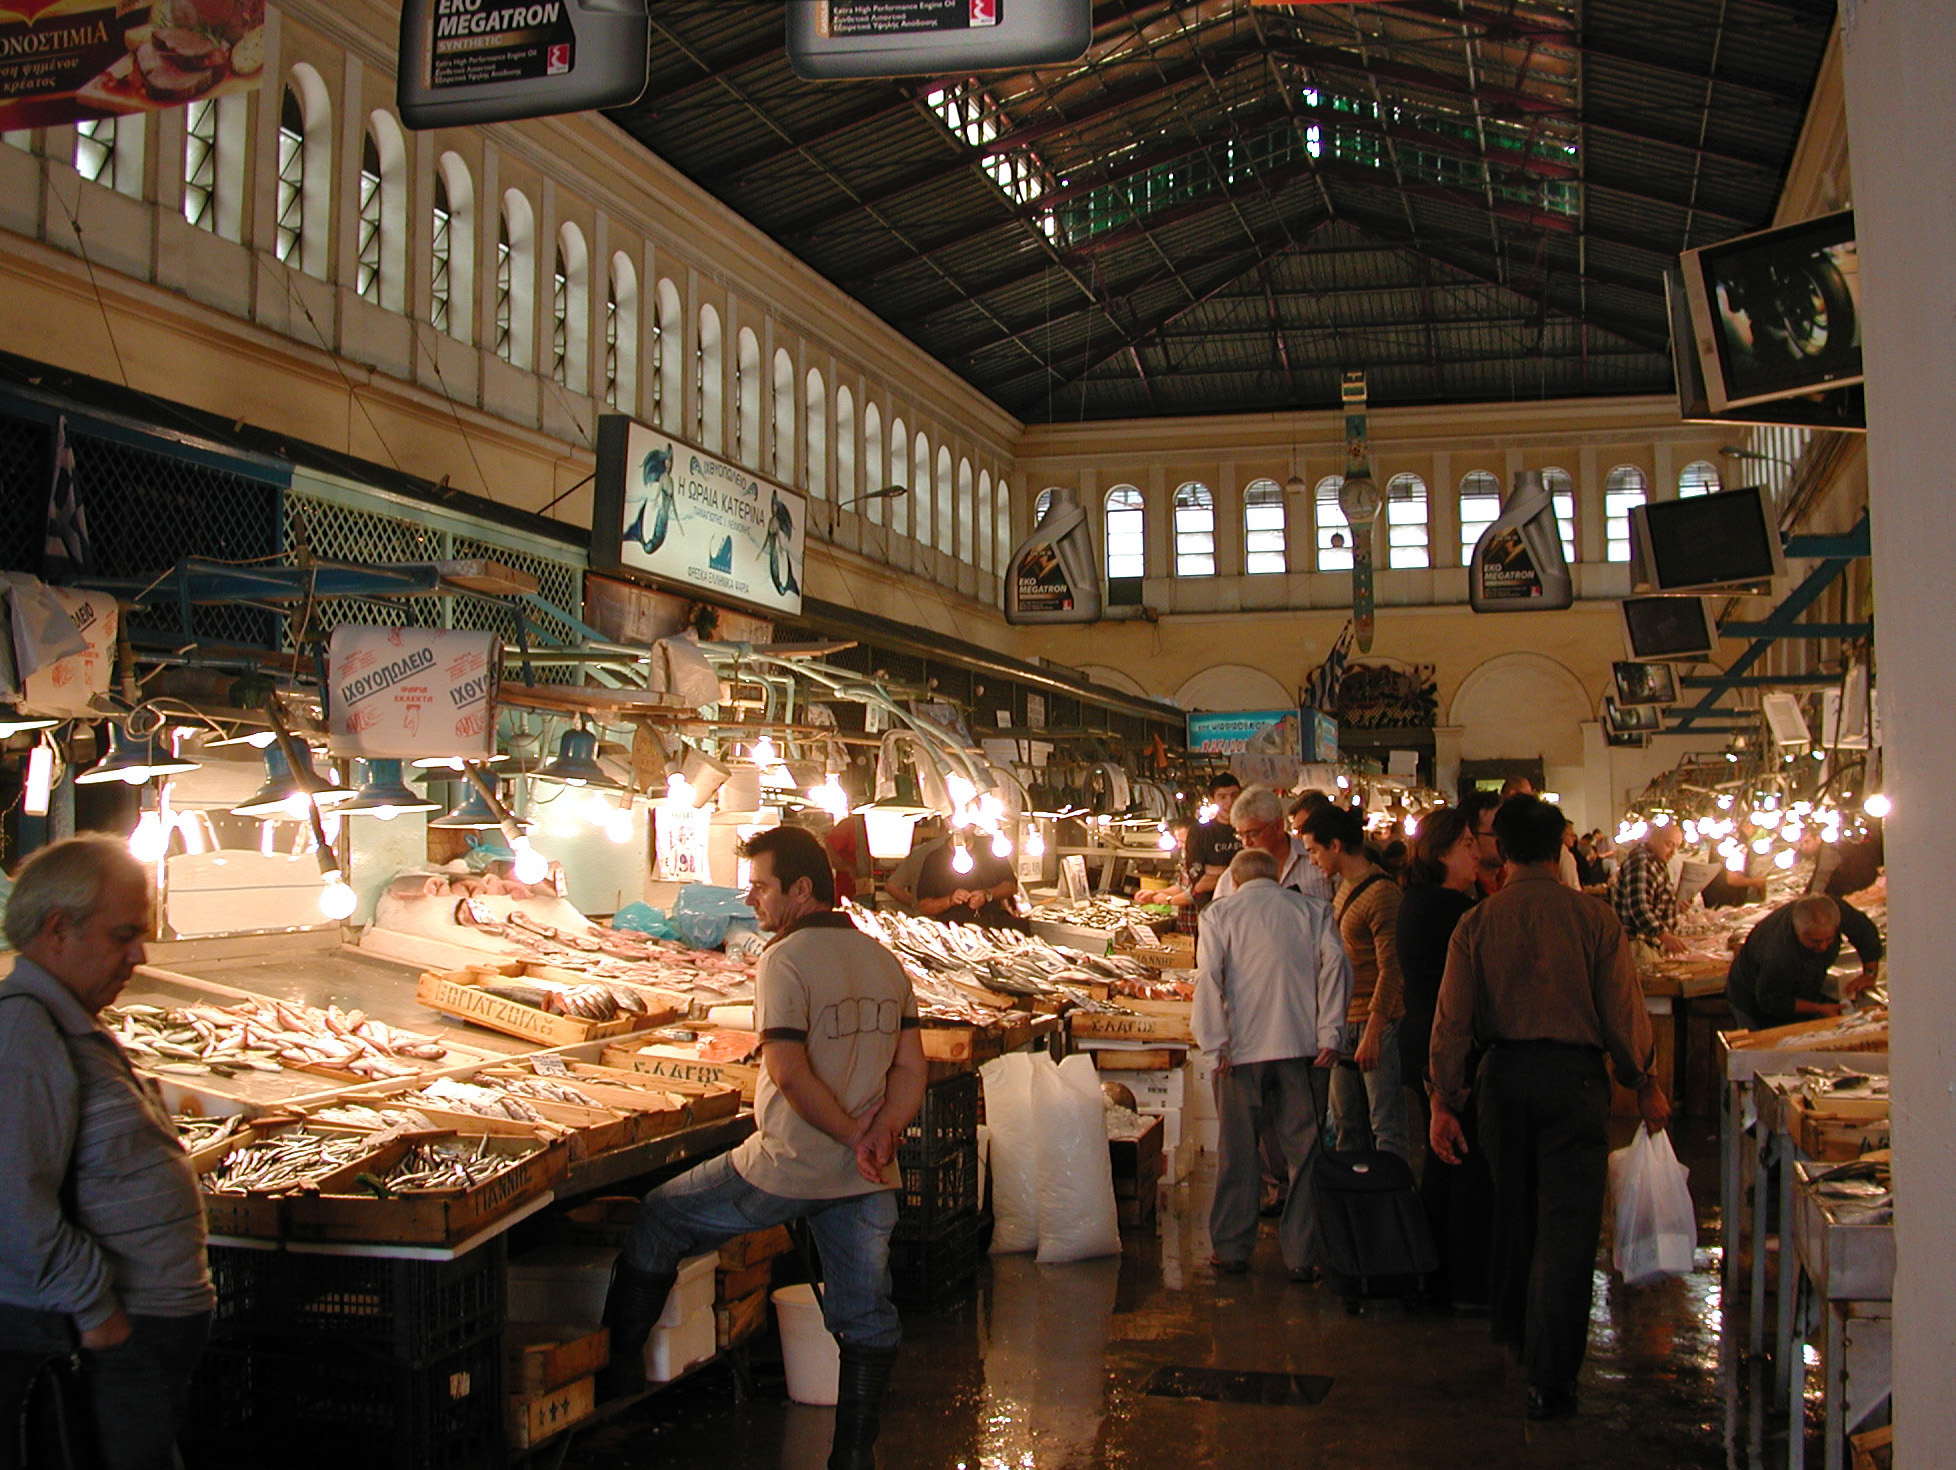
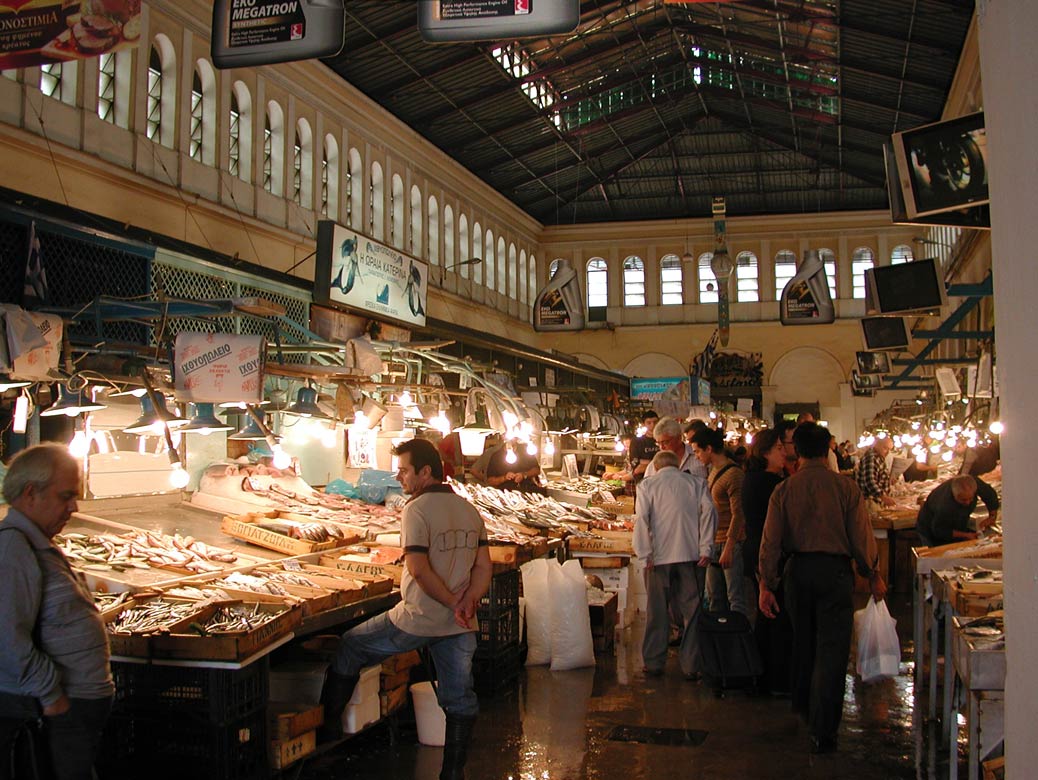


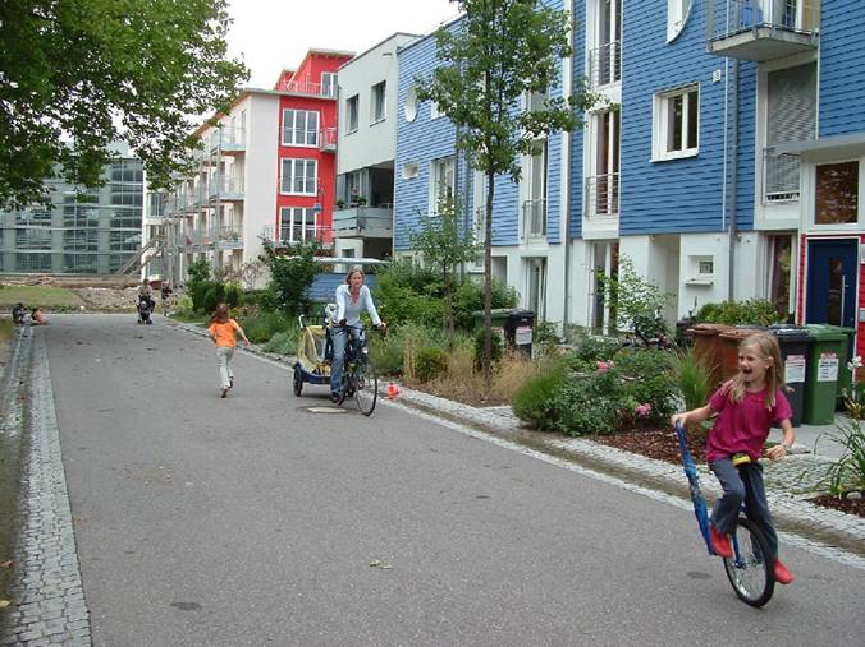


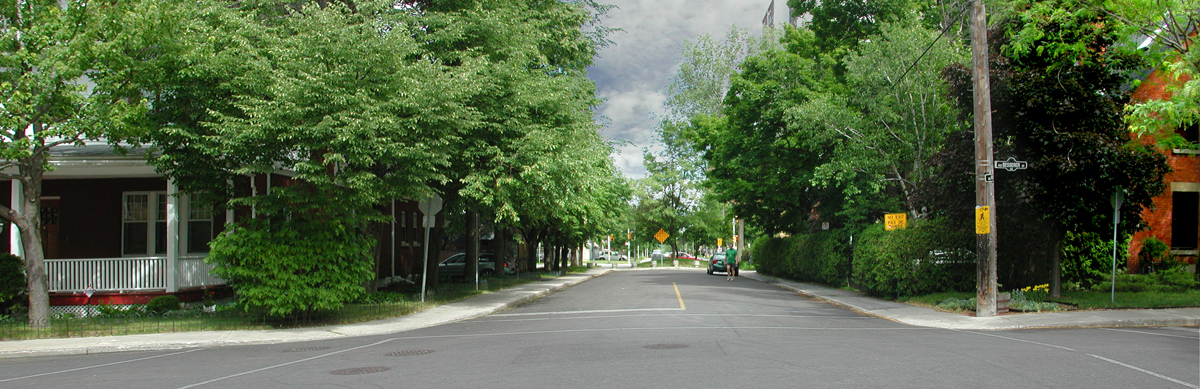

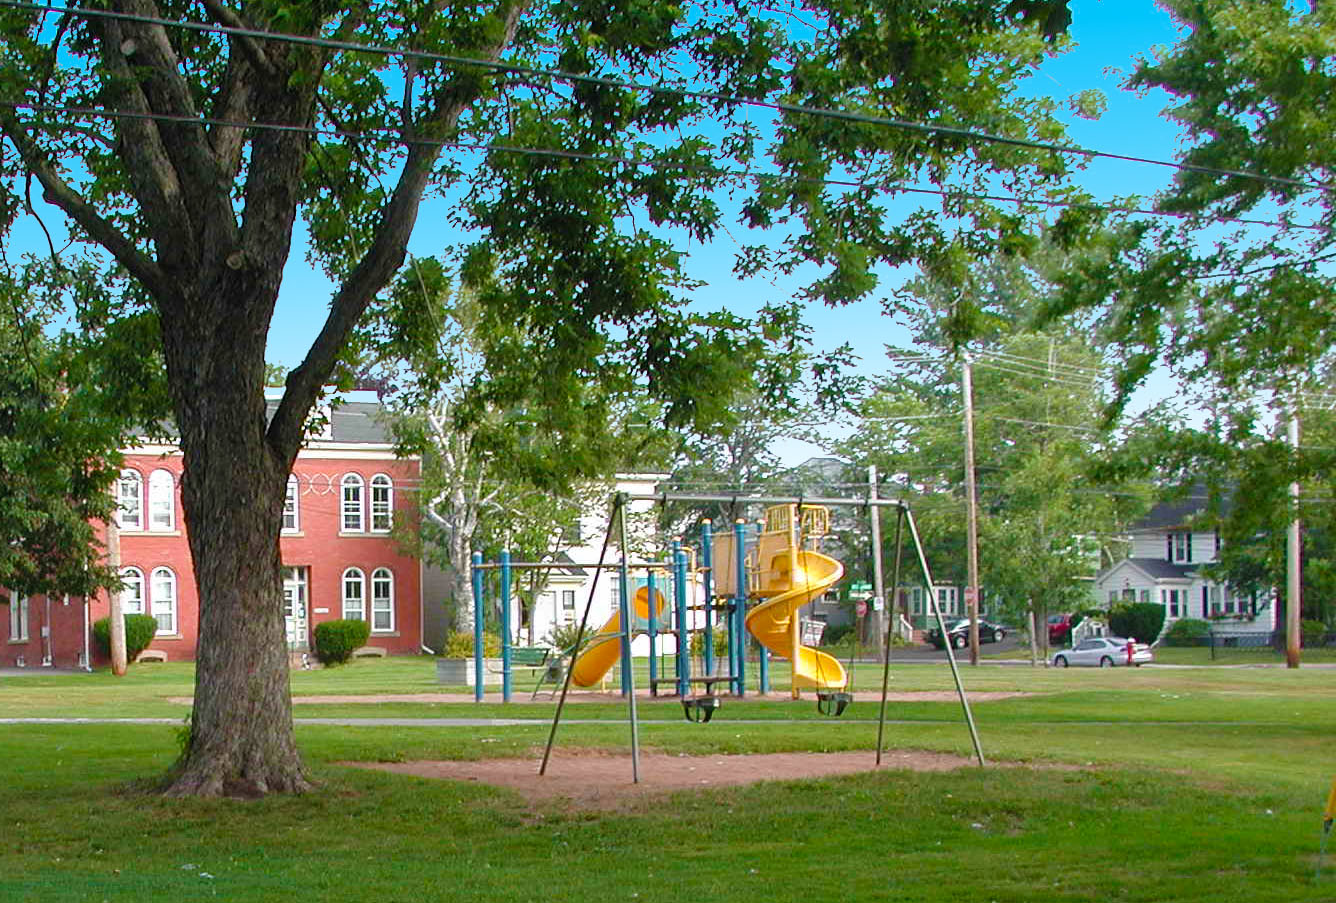

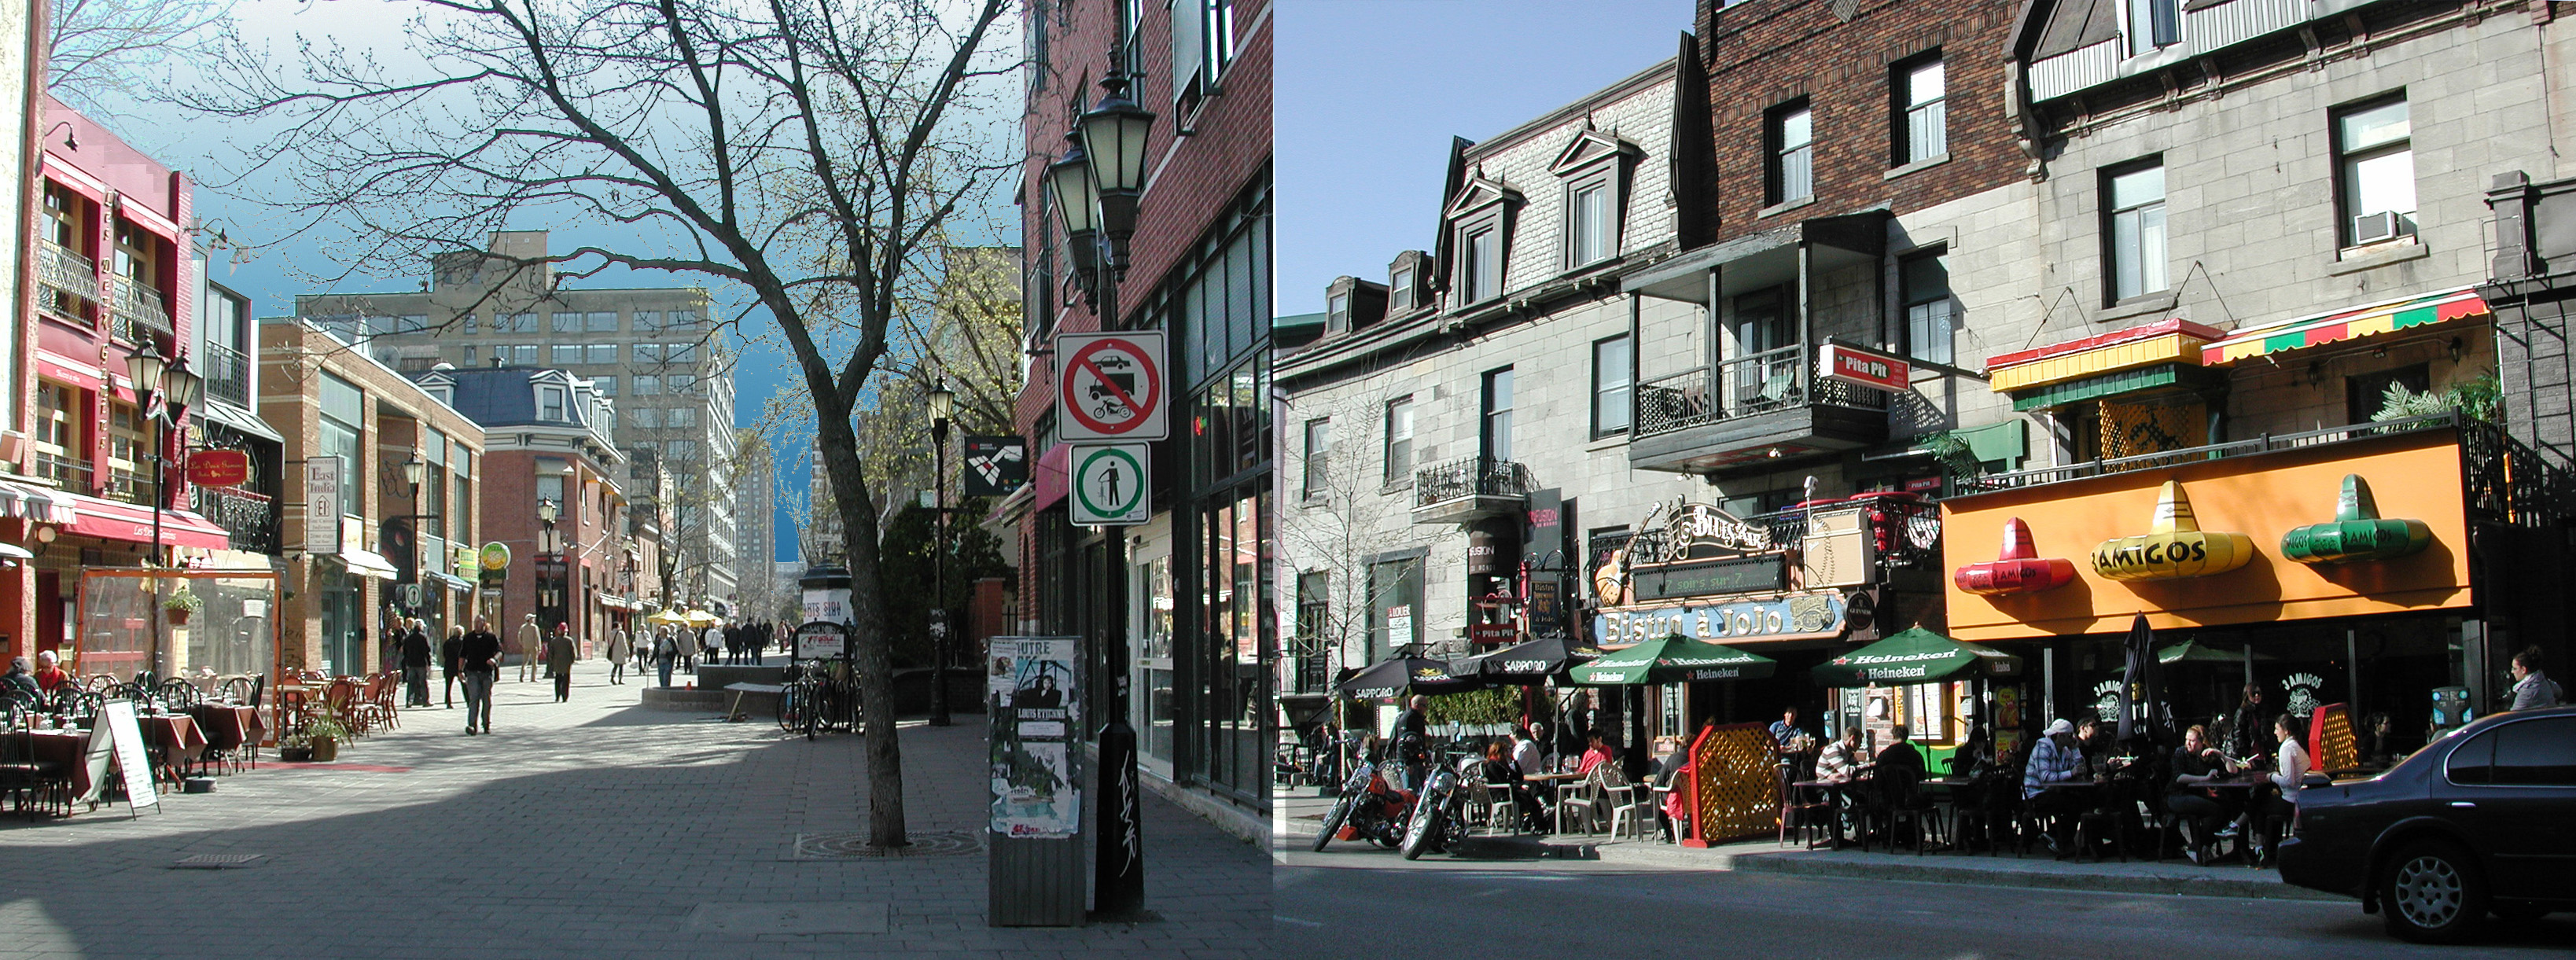
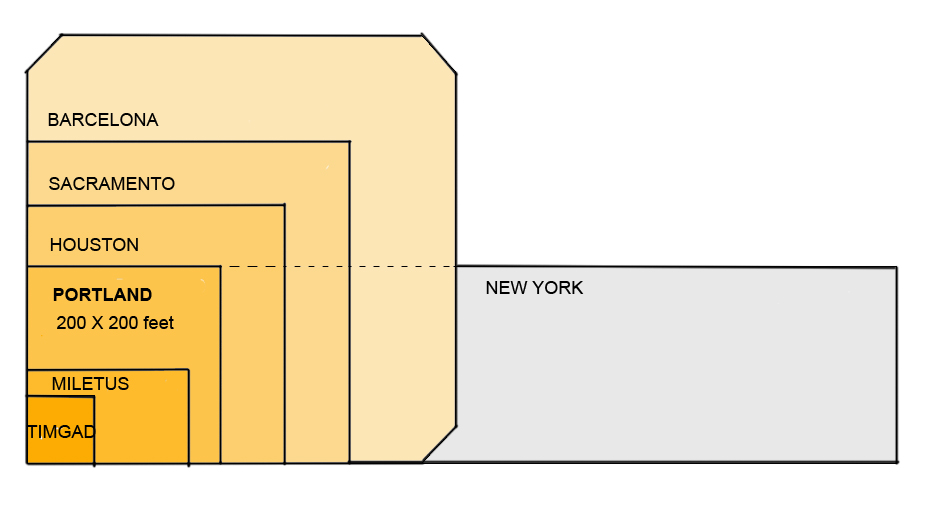


